
Key Points
Over 80 percent of Nepal’s vastly diverse population lives in rural areas, many of which are difficult to reach by road or air.
Nepal’s has experienced substantial economic and population growth within the study period.
From the mid-1990s to the mid-2000s, Nepal experienced a violent insurgency that killed or displaced thousands of its citizens. Child health indicators, however, continued to improve through this period.
Geography, demographics, and history
Bordered on all sides by India and China - the two most populous countries in the world, Nepal is a land apart - a distinctive and diverse country of 30 million people representing a wide range of ethnic, cultural, religious, linguistic, economic, social, and political identities.
A 2011 census found that Nepal’s population includes members of 125 different castes and ethnic groups speaking 123 separate languages. Religious identities are less heterogeneous; just over 80 percent of the population is Hindu, with much smaller segments practicing Buddhism and Islam (9 percent and 4 percent, respectively ).
Indigenous groups and Dalit or “untouchables” make up approximately half of the castes and have been historically marginalized groups. While the caste system was officially abolished in 1963, elements of it still persist informally, particularly in the marginalization of some groups such as the Chamars, Musahars, and Tatma.
Nepal ecological regions

Pandey JP, Dhakal MR, Karki S, Poudel P, Pradhan MS. Maternal and Child Health in Nepal: The Effects of Caste, Ethnicity, and Regional Identity: Further Analysis of the 2011 Nepal Demographic and Health Survey. Calverton, MD: Nepal Ministry of Health and Population, New ERA, ICF International; 2013. https://www.dhsprogram.com/pubs/pdf/FA73/FA73.pdf. Accessed December 11, 2017.
Nepal’s diversity is also reflected in the terrain itself. This South Asian country is divided into three geographic zones. The mountainous region - which includes not only Mount Everest but also seven other peaks above 26,000 feet (8,000 meters) - constitutes about a third of the country’s land area but has less than 7 percent of its population.
A larger “hill zone” comprises 42 percent of Nepal’s land, and a roughly equivalent share of its population. The terai, or low-lying flatlands, make up less than a quarter of Nepal’s landmass but are home to fully half of its people.
This geography represents a barrier to the delivery of health services - in addition to the fact that 81 percent of Nepal’s population lives in rural areas, many of which are difficult to reach by road or air. While the country’s transportation infrastructure is improving, it remains underdeveloped, as does the energy grid. Persistent power shortages hinder both health care delivery and economic development.
Even with these challenges, Nepal’s economy has experienced substantial growth. Part of this is due to a population boom; as recently as 1990, Nepal had only 19 million people - fully a third fewer than today.
During a significant portion of this Exemplar narrative’s study period (1996-2006), Nepal experienced a Maoist insurgency that killed or displaced thousands of its citizens. A 2010 analysis of health outcomes during and after the civil war found that contrary to typical health trends in conflict settings, Nepal had made progress on most health indicators during the conflict period, since both sides saw health care delivery as a priority.
After the insurgency ended, Nepal continued to experience political upheaval and transitions, rotating through 11 prime ministers since the end of the insurgency. Nonetheless, the country has experienced meaningful improvements in certain basic services such as education and sanitation - factors that lie outside the scope of this Exemplar narrative but which can influence the long-term health outcomes for individuals and families.,,
Contextual Factors Contributing to Success
In its campaigns to reduce under-five mortality, Nepal benefited from certain contextual factors, some of which are highlighted in this section.
Economic Growth
Nepal’s gross domestic product (GDP) per capita (purchasing power parity, in constant 2011 international dollars) grew at about 3 percent per year from 2000 to 2017. As of 2017, it stood at approximately $2,443 (PPP, constant 2011 international dollars), still well below that of other countries in the surrounding region...
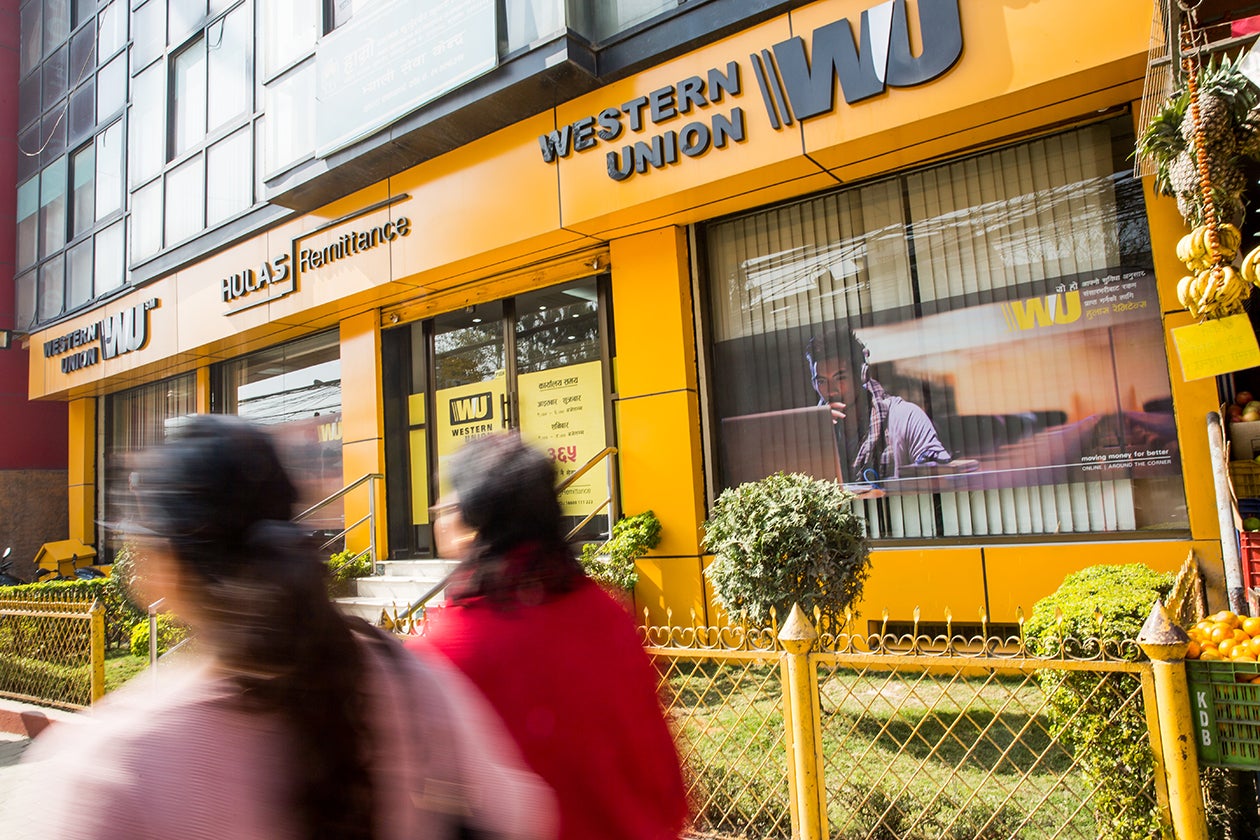
The proportion of Nepalis living below the global poverty line (US$1.90 per day) declined from 46 percent in 2003 to 15 percent in 2010, though it is worth noting that this improvement leveled off between 2010 and 2015. Nepal’s labor force is mostly agricultural, but farming makes up only about a third of the country’s GDP. Most of the country’s reduction in poverty is attributable to non-agricultural production and to remittances from Nepalis working abroad.,
The country’s remittance boom began in 1990, when the issuance of passports was decentralized, making it much easier for rural Nepalis to get them. Men started migrating, primarily to India, the Gulf states, and Malaysia. By 2011, 53 percent of Nepali households had at least one member living outside the country for work. Those workers’ remittances, worth US $5.2 billion, amounted to one-quarter of Nepal’s gross domestic product, placing it among the world’s top-five countries for personal remittances received as a share of the GDP. According to the International Labour Organization, 40 percent of Nepali households rely on remittances to support their basic expenses.
Commitment to gender equality and women's empowerment
Among the most important developments in Nepali life during the study period was the overall advancement in women’s empowerment, education, and economic autonomy.
While Nepal remains a traditionalist society - Nepal ranked 110 out of 144 countries on the global gender gap index - some long-standing imbalances have begun to erode, with positive implications for maternal and neonatal health. Measuring data for empowerment, economic status, and reproductive health, the gender gap index score for Nepal increased by 21 percent, from 0.55 in 2006 to 0.66 in 2016 .
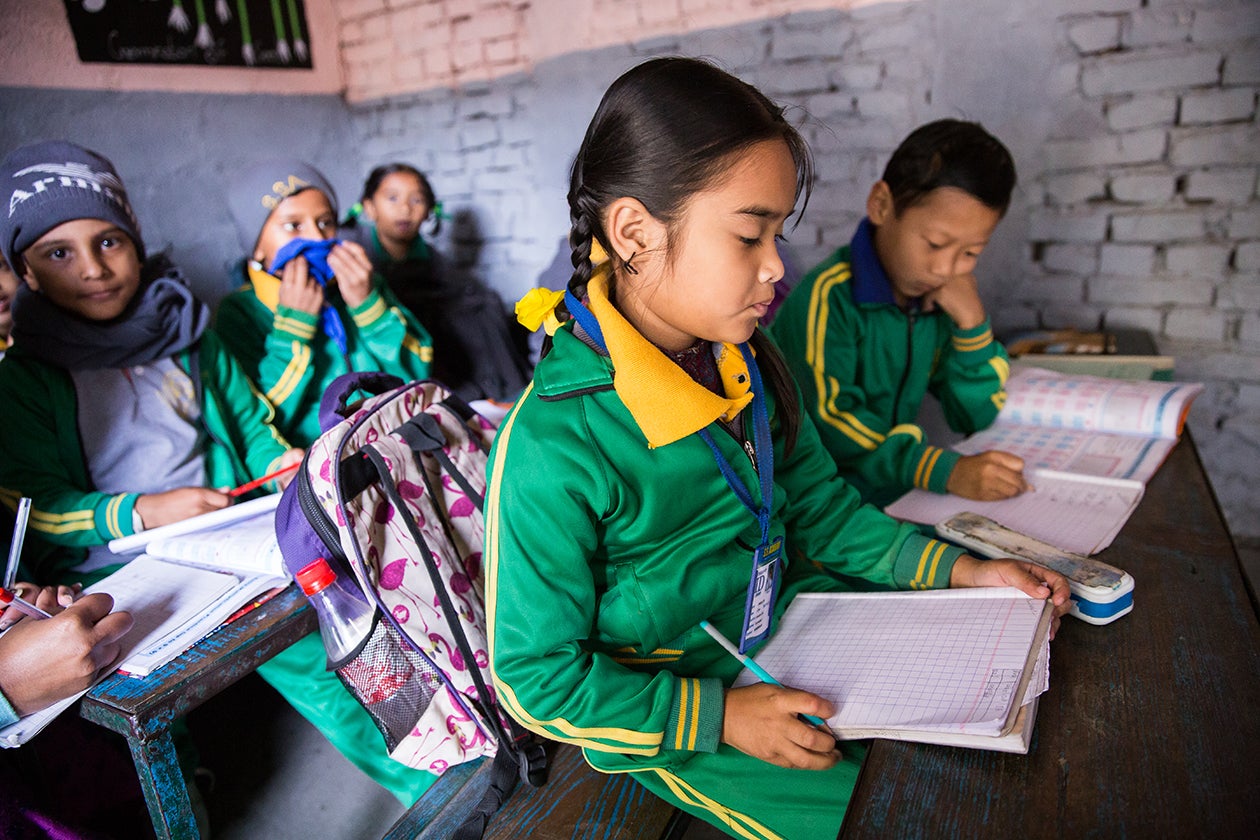
One of the key measures of women's empowerment is access to education, which Nepal has improved at greatly over time. For one, Nepal has improved the percentage of all children enrolled in primary school, from 73% at the turn of the century to 97% by 2015 . In addition, the gender parity index (GPI) for primary school enrollment (which measures the ratio of females to males enrolled in primary school) also improved substantially over this time, from 0.77 in 2000 to 1.08 in 2015 . This shows that while in 2000, only around three-quarters the number of females as males were enrolled in primary school, by 2015, there were more females enrolled than males.
Among these effects is an increase in the ability of women to obtain better care for themselves and their children. MOH interviewees described the growing interest of Nepali mothers in seeking pediatric immunizations, as well as postnatal care.
In assessing the health impacts of women’s empowerment, one study reported that “reduction in fertility, changes in education and wealth, improvements in components of the human development index, gender empowerment and anemia each explained more than 10 percent of the district variation in maternal mortality.”
Nepal’s major initiatives to increase women’s rights began in the mid-1990s, with such measures as the establishment of a Ministry of Women and Social Welfare, which had a mandate for “coordinating and monitoring of development programmes targeted to women.”
By 1997, the new ministry had developed a National Plan of Action for Gender Equality and Women’s Empowerment. In 2010, the Health Sector Gender Equality and Social Inclusion Strategy provided guidance on factoring gender considerations into health care delivery and policy making.
In addition to these official pronouncements, another development was beginning to reshape gender relations in Nepal: economic change. These changes included the initiation of government policies specifically intended to benefit women, including microcredit programs and expanded property and inheritance rights.
The robust economic growth that Nepal experienced during the study period also played a part in reshaping gender relations, including the infusion of remittance funds from overseas workers. Many of the workers were men sending money back home to wives and mothers, who now had not only more cash on hand, but more influence over how to use it.
Some interviewees indicated that this flow of money and the exposure of family members to higher-quality health care in other countries may have increased women’s expectations of health care services, and their ability to pay to have those expectations fulfilled.
Between 1996 and 2006, the Maoist insurgency took many men away from their homes for extended periods and left their families without a male breadwinner - either temporarily or permanently. This created great hardship for many Nepali women, but it also expanded their scope for individual decision making, according to some interviewees.
Another theme arising in the interviews was the empowering effect of government-sponsored village mothers’ groups, and the inspiring example of FCHVs in communities.
One interviewee said, “The awareness among women and the community; community participation; the system of FCHVs; and active mothers’ clubs were some of the contributing factors [to reductions in under-five mortality]. So I would not say it’s only because of medical interventions that child mortality has reduced.”
Ironically, this heightened sense of gender empowerment may be threatening the long-term sustainability of the FCHV program, as women all over Nepal gain a wider range of opportunities for employment and self-advancement.
This transformation in gender relations is reshaping society, even at the highest levels of government; World Bank data shows an increase in female representation in Parliament, from 6 percent of all members in 2006 to 30 percent by 2017. In 2018, national election laws instituted gender quotas in local government. One MOH official said that as a result of these increases in the presence of women in politics, “I believe that things will start changing very fast.”
Access to family planning
Among the changes that have already begun to advance maternal health and neonatal survival is what one interviewee referred to as an “opening of reproductive rights,” citing this as a source of improvement in under-five mortality rates.
Contraceptive use in Nepal has risen sharply over the past two decades. In 2001, 27 percent of Nepali women did not have their family planning needs met; this declined to 18 percent by 2016.
The National Planning Commission’s 2002 poverty reduction plan identified gender equity as a high priority, including the health policy aims of reducing unwanted pregnancy, increasing adolescent reproductive health awareness, expanding access to contraceptives, and promoting equal participation of men and women in reproductive health decisions.
Also in 2002, despite restrictions imposed by international donors like the US Agency for International Development (USAID), Nepal passed legislation legalizing abortion. The country expanded abortion services to include doctors, nurses, and midwives as providers, and in 2009 established abortion access as a human right.
As a result of the availability of modern birth control methods, increased control over health decision making, the legalization of abortion, an increase in girls’ school attendance, economic growth, and other trends, Nepal’s fertility rate declined from 4.6 births per woman in 1996 to 2.3 by 2016.
One interviewee underscored the link between access to family planning services and improved child survival rates: “Frequent pregnancies were one of the causes of increased childhood mortality,” said the interviewee. “If there is not enough spacing or even limiting done with your childbearing, then you end up having more children, and children are not taken care of. [And the] mother dies and the children are worse off."