
A variety of factors contributed to India’s progress in reducing neonatal and maternal mortality rates. In this study, these interrelated factors were mapped to a conceptual framework with consolidated factors from existing evidence and frameworks that included categories of distal, intermediate, and proximate drivers, as shown below in Figure 5. In this section, progress on key proximate drivers is highlighted—especially with regard to intervention coverage spanning the continuum of maternal and newborn care, including preconception, antenatal care, delivery care, and postnatal care.
Figure 5: Conceptual framework for the drivers of maternal and neonatal mortality decline

As each indicator is discussed, progress is contextualized within India’s four major national health policy periods, shown below in Figure 6. More detailed descriptions of each of these policy periods can be found in the How did India implement section of the .
Figure 6: India’s national-Level health policy periods

After reviewing trends in selected key maternal and newborn health (MNH) intervention coverage indicators, quantitative analyses are presented that link this progress to reductions in neonatal mortality rate (NMR) and maternal mortality ratio (MMR). These include an analysis that isolates the impact of fertility decline on mortality levels using Jain’s decomposition method as well as an analysis that calculates the fraction of neonatal mortality attributable to a variety of risk factors. Although both of these analyses have specific limitations, each also offers unique insights. Together, this body of evidence tells a story about how proximate factors contributed to India’s reductions in neonatal and maternal mortality.
Fertility decline has contributed to mortality reductions, in part by influencing related risk factors
Higher family planning coverage and increased age at marriage are key proximate factors related to fertility decline in India’s higher mortality state cluster. However, other intermediate and distal factors such as women’s education, employment, socioeconomic status, and other social determinants have also contributed to this trend. Defined as the number of children a woman would have if she were to experience the prevailing fertility rates at all ages and survived throughout her childbearing years, India’s total fertility rate declined from 3.2 to 2.1 births per woman nationally between 2000 and 2019. In the higher mortality state cluster, total fertility rate declined from 4.2 births per woman in 2000 to 2.6 births per woman in 2019, as shown below in Figure 7. The higher mortality Exemplar states of Madhya Pradesh, Rajasthan, and Uttar Pradesh had similar total fertility rates in 2019, respectively at 2.7, 2.5, and 2.9 births per woman. Odisha had a markedly lower total fertility rate, at 1.8 births per woman, closer to total fertility rates typically seen in the lower mortality state cluster.
Figure 7: Fertility trends in India’s higher mortality state cluster

Office of the Registrar General and Census Commissioner, Government of India. Sample Registration System Statistical Report 2019. New Delhi: Government of India, 2022. Accessed September 10, 2024. https://censusindia.gov.in/nada/index.php/catalog/44375/download/48046/SRS_STAT_2019.pdf
Trends in age-specific fertility rates highlight that decreases have been particularly notable for younger women and girls. The age-specific fertility rate nationally for women and girls ages 15 to 19 decreased 62.9% from 116 to 43 births per 1,000 woman-years between India’s 1992–1993 NFHS and 2019–2021 NFHS., This decline has been even more substantial in the higher mortality Exemplar states of Madhya Pradesh, Rajasthan, and Uttar Pradesh, which all experienced age-specific fertility declines among women and girls ages 15 to 19 by over 70% between these two surveys.,
Trends related to fertility rate affect multiple levels of the conceptual framework, including the broader health system. When combined with India’s population momentum, the declining fertility levels have resulted in a relatively steady number of annual births in recent decades. As a result, maternal and newborn health programs have not needed to keep pace with a growing number of births per year. Fertility decline is therefore a key factor in our study, influencing proximate factors in an interconnected fashion and influencing India’s broader story of progress. Since risks tend to be higher at younger maternal age and higher parity, fertility decline might also be associated with a shift in the age-parity distribution of births that reduced maternal and neonatal mortality risk.
Assessing fertility decline as a contributor to NMR/MMR improvements
India’s higher mortality state cluster has experienced substantial decreases in fertility—as noted above—with the total fertility rate declining from 4.2 to 2.6 births per woman between 2000 and 2019. As described in Jain’s decomposition methodology, declines in fertility translate to fewer high-risk pregnancies by way of longer birth intervals, lower birth parity, as well as decreased birth rates specifically among teen girls and older women. This analytical approach isolates the impact of fertility decline on neonatal and maternal mortality reduction.
Declines in fertility levels within the higher mortality state cluster were associated with 369,123 fewer neonatal deaths and 30,899 fewer maternal deaths in 2020 than would have been expected if fertility levels had remained constant since 2000. This decomposition approach attributes the remaining portion of mortality reductions to “safe motherhood” initiatives—interventions that target maternal and newborn health such as antenatal care and institutional delivery. Together, fertility decline and improved coverage of safe motherhood initiatives led to 786,708 neonatal lives and 82,267 maternal lives saved in 2020 compared to what would have been expected if fertility rate and intervention coverage levels had remained constant since 2000. This finding, shown below in Figure 8, highlights the impact of fertility decline as a key contextual factor related to NMR and MMR decline in India’s higher mortality state cluster, in tandem with other health care indicators commonly associated with mortality reductions.
Figure 8: Attribution of mortality reductions to fertility decline and improved intervention coverage in India’s higher mortality state cluster

Office of the Registrar General and Census Commissioner, Government of India. Sample Registration System Statistical Report 2019. New Delhi: Government of India, 2022. Accessed September 10, 2024. https://censusindia.gov.in/nada/index.php/catalog/44375/download/48046/SRS_STAT_2019.pdf
Improvements in proximate reproductive, maternal, and newborn health coverage indicators
The proximate MNH intervention coverage factors described in this section were found to most directly contribute to improved maternal and newborn health outcomes in India over recent decades and were in turn influenced by broader distal and intermediate factors in the framework. Throughout this section, we mention upstream intermediate and distal factors that fed into this progress, which are described in more depth in the and sections.
Contraception
India has increasingly met demand for family planning using modern methods over recent decades. As of India’s 2019–2021 NFHS, 83.9% of family planning demand was satisfied using modern methods nationally. While demand for family planning using modern methods is lower in the higher mortality state cluster, the gap has narrowed over recent decades, as shown below in Figure 9. In the 1992–1993 NFHS, demand satisfied was 12.8 percentage points higher nationally than in the higher mortality state cluster, but by the 2019–2021 NFHS, demand satisfied was only 6.1 percentage points higher nationally than in the higher mortality state cluster.,
Figure 9: Family planning demand satisfied by modern methods in India’s higher mortality state cluster

The higher mortality Exemplar states of Madhya Pradesh, Odisha, Rajasthan, and Uttar Pradesh showed substantial variation in family planning demand satisfied. Each of these Exemplar states—with the exception of Odisha—showed particularly notable increases in demand satisfied between the 2015–2016 NFHS and 2019–2021 NFHS., In each successive policy period across India, family planning has become more integrated with broader maternal health, which is also true specifically for the higher mortality Exemplar states. For example, in the National Health Mission/Reproductive, Maternal, Newborn, Child and Adolescent Health (NHM/RMNCH+A) policy period starting in 2012, Rajasthan identified districts with poor family planning and maternal health indicators and employed an integrated, comprehensive approach to targeting those districts. As one government health expert in Rajasthan noted:
“Then came NHM/RMNCH+A. . . . Everyone realized that the things in compartmentalization can’t work. The maternal health, the child health, the family planning—they must work together.”
Rajasthan has also implemented a family planning logistic management information system that has improved the availability of contraceptives. Another example of a state-specific initiative to promote family planning is Uttar Pradesh’s State Innovations in Family Planning Services Project Agency (SIFPSA), which leverages community partnerships, media campaigns, private-sector involvement, and other innovative approaches to promote access to family planning. Efforts across India nationally have increasingly promoted access to various contraceptive methods, but the vast majority of modern contraceptive use remains female sterilization, including in the higher mortality Exemplar states.
Antenatal care
From 1989 to 2018, the percentage of pregnant mothers in India who received an antenatal care (ANC) visit increased from 64.8% to 93.7% nationally., Although coverage remains slightly lower in the higher mortality state cluster, the coverage gap narrowed substantially over the last three decades. In the higher mortality state cluster, coverage of at least one ANC visit improved from 59.2% to 91.5% between 2000 and 2018, as shown below in Figure 10., In 2020, the higher mortality Exemplar states of Madhya Pradesh, Odisha, Rajasthan, and Uttar Pradesh had even higher coverage, at 98.1%, 98.8%, 98.0%, and 96.8%, respectively. Across the higher mortality state cluster, coverage of at least one ANC visit increased the most during the RCH-I policy period from 1997 to 2005.
In the 1990s, coverage of at least four antenatal care visits (ANC4+) was substantially lower in the higher mortality state cluster than in the lower mortality state cluster. Remarkable progress, especially during the RCH-II/NRHM policy period from 2005 to 2012 helped to narrow this gap. The higher mortality Exemplar states of Madhya Pradesh, Odisha, Rajasthan, and Uttar Pradesh respectively experienced AARCs for ANC4+ coverage of 11.1%, 8.7%, 13.8%, and 16.0% during this period—the fastest improvement each of these states experienced during any policy period.,,
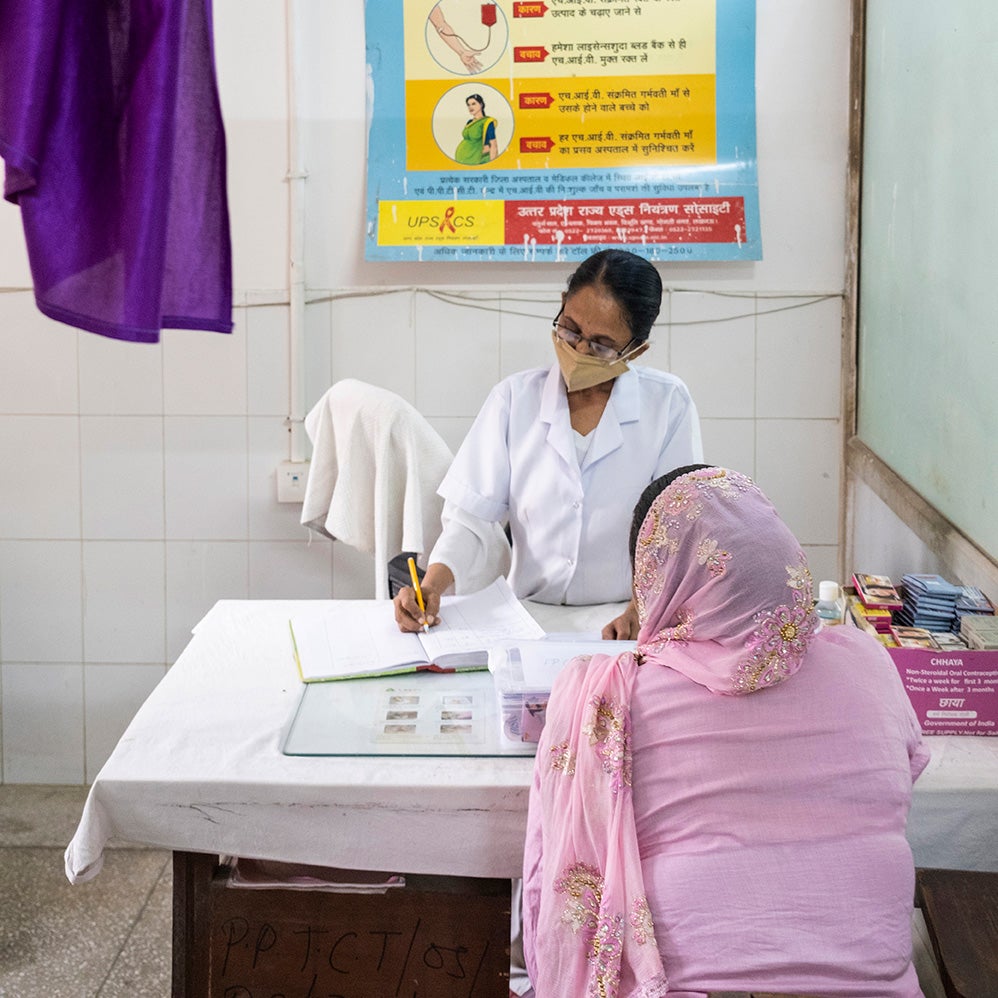
In addition to national programming, such as the Accredited Social Health Activists (ASHA) program, the Janani Suraksha Yojana (JSY) scheme, and Janani Shushu Suraksha Karyakaram (JSSK) initiative, higher mortality Exemplar states developed innovative approaches to bolster ANC coverage. For example, Uttar Pradesh developed a model of providing ANC at a fixed time each month via “safe motherhood weeks” in community health centers (CHCs) and Village Health and Nutrition Days (VHNDs), leveraging additional capacity of private-sector doctors. The national government later adopted this approach into a program known as Pradhan Mantri Surakshit Matritva Abhiyan.
Figure 10: Any antenatal care coverage trends in India’s higher mortality state cluster

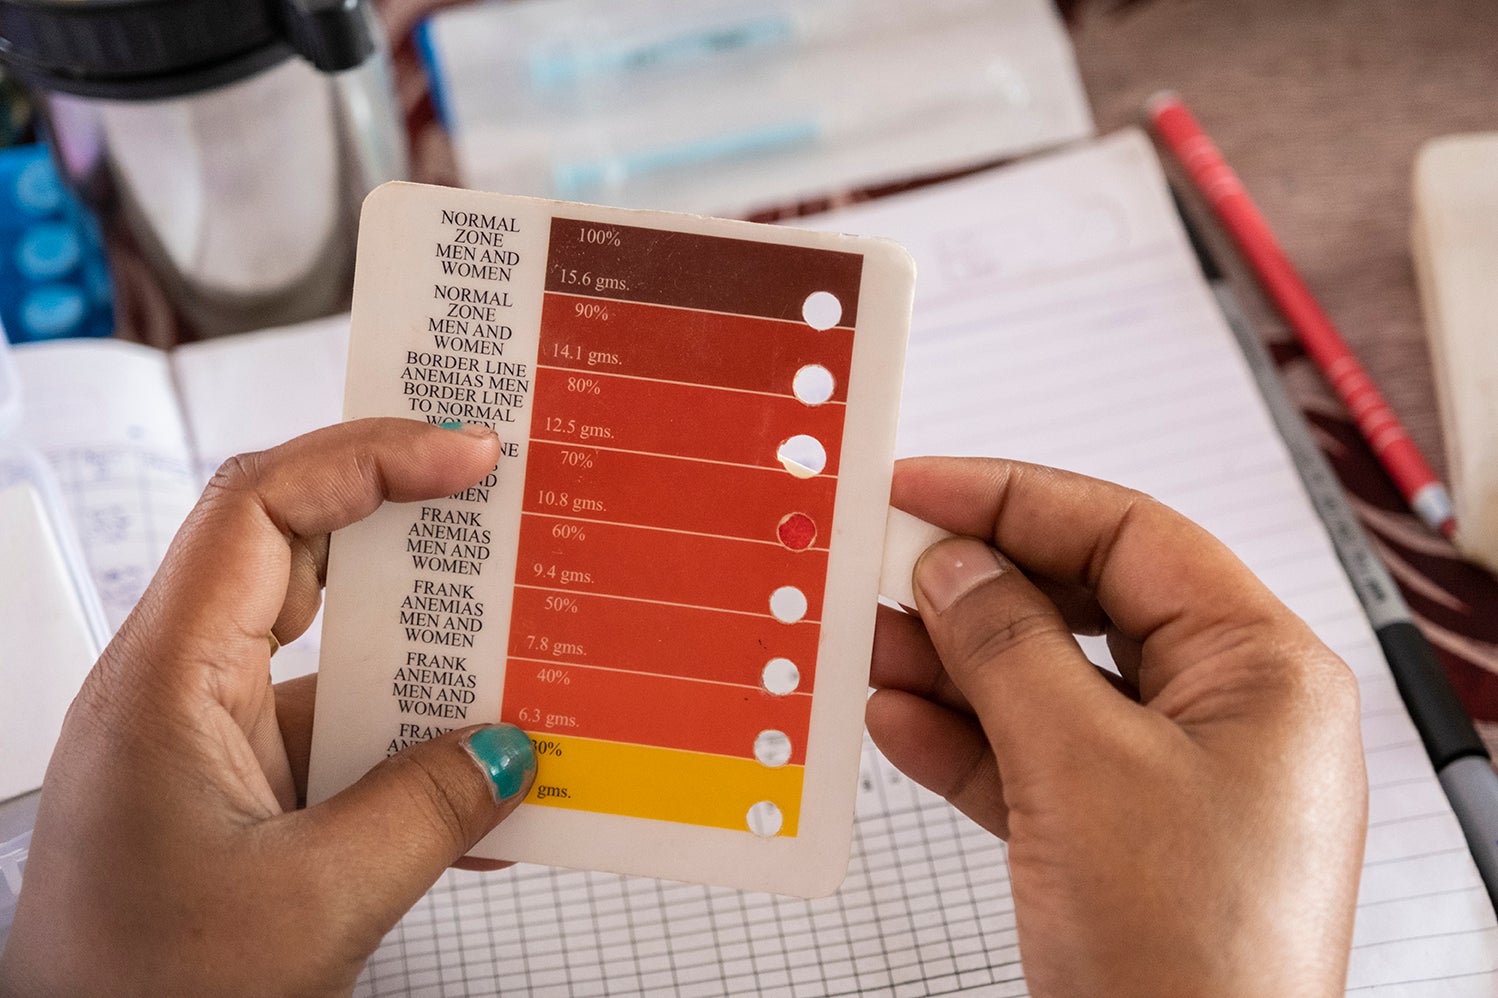
In addition to coverage improvements, evidence suggests that quality of ANC has also improved in India’s higher mortality cluster. To approximate quality of ANC, we employed an index that included nine components that generally reflect whether ANC was administered in a timely manner by a skilled provider who conducted key screenings, tests, and examinations as appropriate—collectively representing a maximum score of 13 points. Using that index, high-quality ANC (ANCq) was defined as ANC that satisfied at least 9 of the 13 points. The percentage of women in the higher mortality state cluster who received high-quality ANC improved from 15.4% in 1996 to 78.1% by 2018., High-quality ANC coverage also rapidly improved in the higher mortality Exemplar states. In 1996, Madhya Pradesh, Odisha, Rajasthan, and Uttar Pradesh had high-quality ANC coverage levels, respectively, of 21.0%, 32.5%, 17.3%, and 12.7%. By 2020, these states’ high-quality ANC coverage had respectively risen to 92.5%, 97.3%, 93.8%, and 83.5%.
The higher mortality Exemplar states employed unique approaches to improve the quality of ANC, addressing context-specific issues they faced. For example, in Madhya Pradesh the Pre-Conception and Pre-Natal Diagnostic Techniques Act promoted access to ultrasounds. This policy aimed to ensure all pregnant women received one ultrasound between weeks 18 and 20 of pregnancy, and at least three ultrasounds during pregnancy. As a part of this policy, providers were empowered and financially incentivized to provide ultrasounds, with leaders promoting appropriate use of the procedure. Another higher mortality Exemplar state, Odisha, also promoted ultrasound use and emphasized the importance of having at least one antenatal care visit provided by a doctor. Odisha also instituted a system in which women were given a red card at an ANC visit if a provider noticed a factor that would qualify the pregnancy as higher risk. This card is then brought to all future health care visits throughout a woman’s pregnancy to more easily signify that a risk factor has already been identified.
Institutional delivery
In the RCH-II/NRHM policy period from 2005 to 2012, the central government placed a strong priority on promoting institutional delivery. The ASHA program and the Janani Suraksha Yojana (JSY) scheme complemented each other by facilitating community-level connection to the health system and mitigating financial barriers to delivery care. The higher mortality Exemplar states implemented several specific initiatives beyond these national-level programs that also contributed to institutional delivery progress.
For example, Odisha introduced maternity waiting homes—known as Maa Gruha—in hard-to-reach areas. Women were encouraged to come to the homes two weeks before the estimated day of delivery and receive antenatal care, food, and housing. This initiative was intended to mitigate physical and logistic barriers to accessing care nearer to the time of delivery, and has spread throughout rural areas of the state.
Rajasthan implemented a policy referred to as Prasav Sakhi, which allowed all women to have a birth companion with them during delivery in facilities. This companion could be any other woman who had already experienced childbirth, with the facility mandated to provide a gown and mask for this companion.
Recently, Madhya Pradesh instituted a scheme called Mukhya Mantri Shramik Seva (Prasuti Sahayata) Yojana, which entitled women to additional financial incentives if they received antenatal care, had an institutional delivery, and ensured their child was breastfed early and received necessary first vaccinations. This program serves as a state-specific augmentation of the national-level conditional cash transfer initiatives, meant to further spur utilization of maternal care, especially institutional delivery.
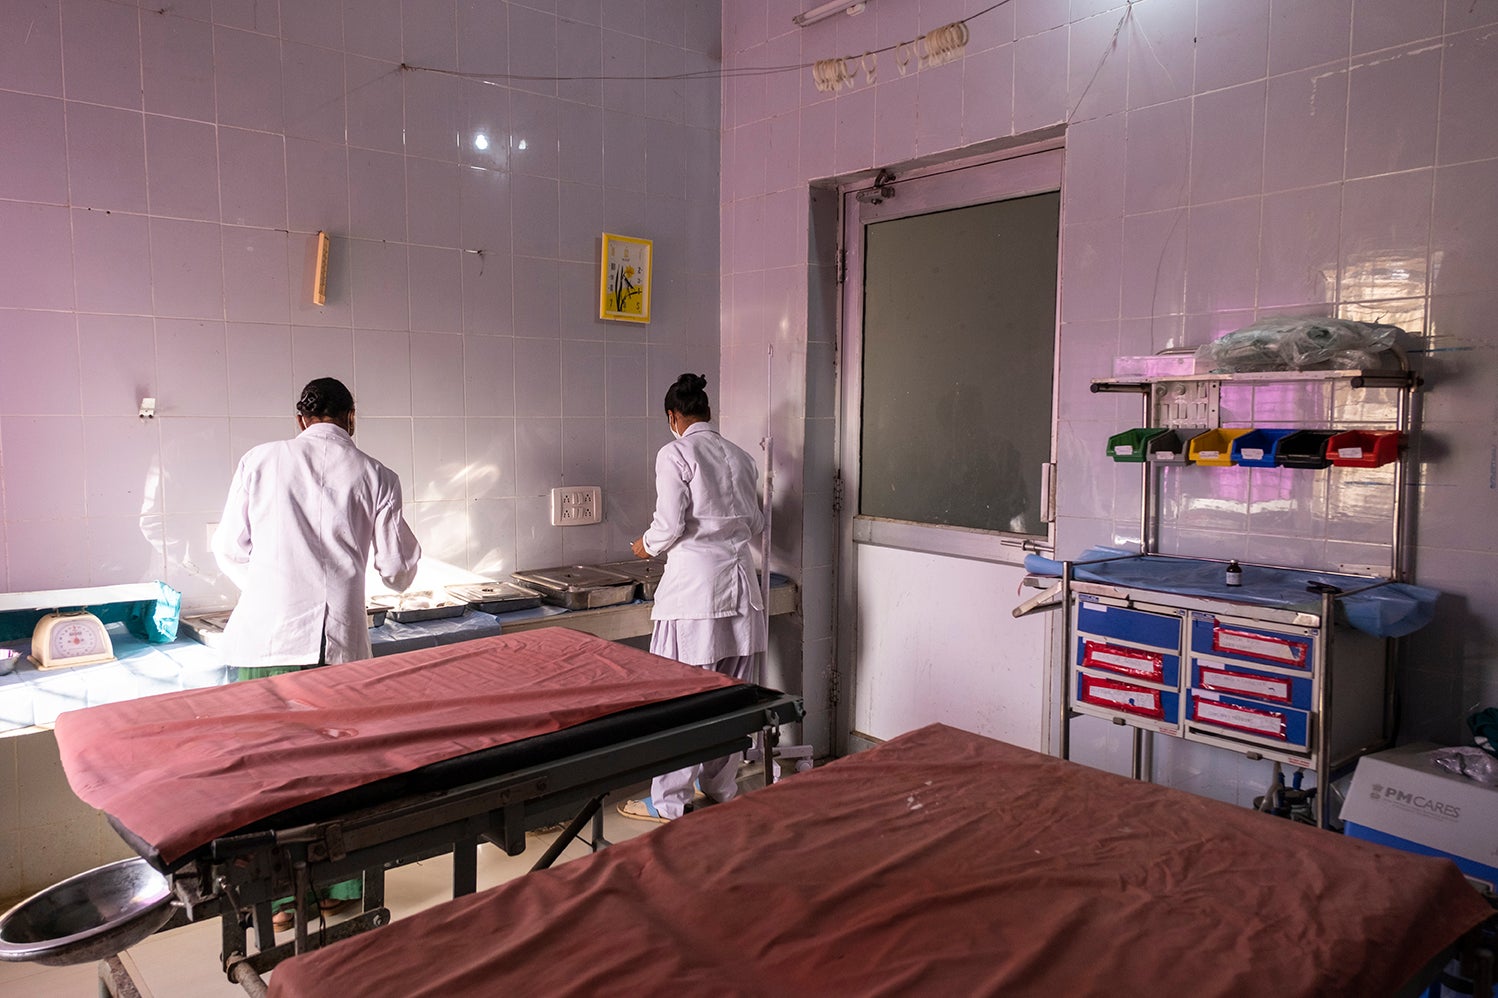
Below, Figure 11 shows trends in institutional delivery rates among higher mortality Exemplar states and the higher mortality state cluster overall. Between 2000 and 2018, the institutional delivery rate in India improved from 41.0% to 89.9%., The original gaps between the higher mortality state cluster and India nationally narrowed substantially thanks to accelerated progress among higher mortality states especially during the RCH-II/NRHM period. The AARC of 13.2% for institutional delivery rate in the higher mortality state cluster during the 2005 to 2012 RCH-II/NRHM period was almost twice as fast as the progress experienced during any other policy period.,, As of 2020, the institutional delivery rates in the higher mortality Exemplar states of Madhya Pradesh, Odisha, Rajasthan, and Uttar Pradesh were, respectively, 91.7%, 92.1%, 96.3%, and 87.8%.
Figure 11: Institutional delivery trends in India’s higher mortality state cluster

While institutional delivery rates in the higher mortality state cluster have increased dramatically in recent decades, more than half of these deliveries are in lower-level health facilities. As of the 2019–2021 NFHS, 59.3%, 55.4%, 57.9%, and 51.8% of institutional deliveries in Madhya Pradesh, Odisha, Rajasthan, and Uttar Pradesh, respectively, occurred in lower-level health facilities. The higher mortality Exemplar states have implemented several measures to improve quality of care at these facilities.
For example, Rajasthan introduced a safe birth checklist known as Kayakalp in partnership with Jhpiego, which included the requirement that women remain in the hospital for 48 hours after delivery.Conversations with experts in Rajasthan indicated that this checklist has been particularly effective in reducing rates of postpartum infection.
Odisha also introduced this safe birth checklist and began providing financial bonuses for regular staff in high-performing health facilities that met quality standards. Experts noted that the state has also started assessing patient satisfaction and rewarding health workers for high performance as opposed to penalizing workers for low performance.
Cesarean section
As more women have delivered in facilities across the higher mortality cluster, more have also delivered via cesarean section (C-section) as shown below in Figure 12. India’s C-section rate rose from 7.5% to 22.4% between 2000 and 2018, whereas the C-section rate in the higher mortality state cluster increased from 3.1% to 13.7% over the same period., In the higher mortality state cluster, the C-section rate in public hospitals remained fairly constant. Between the 2005–2006 NFHS and 2019–2021 NFHS surveys, the institutional C-section rate in public hospitals decreased slightly from 15% to 14%., However, over this same period, the institutional C-section rate in private hospitals increased from 23% to 42%.,
With lower hospital delivery rates, the higher mortality state cluster has prioritized making C-section—and other lifesaving obstetric interventions—accessible at community health centers (CHCs) that have been upgraded to first referral units (FRUs). Higher mortality Exemplar states have subsequently implemented plans to further promote the capacity of FRUs, such as Rajasthan’s Chirayu program which, among other goals, aimed to strengthen the C-section capacity of FRUs. One government stakeholder in Rajasthan said this of the program:
“Chirayu program we have started. The 10 districts which are having almost highest infant mortality, we have intensified visits and [are] working on the gaps. We worked for two to three years; things have been changed in a good manner.”
Figure 12: C-section trends in India’s higher mortality state cluster

Postnatal care
Between the 1998–1999 NFHS and 2019–2021 NFHS, national coverage of postnatal care for the woman or baby improved from 13.4% to 82.8%., Although this percentage was slightly lower overall in the higher mortality state cluster in the 2019–2021 NFHS at 79.7%, the higher mortality Exemplar states generally had substantially higher postnatal care coverage, as shown below in Figure 13. In the 1998–1999 NFHS, Madhya Pradesh, Odisha, Rajasthan, and Uttar Pradesh had postnatal care coverage levels, respectively, of 2.3%, 6.2%, 0.9%, and 3.3%. By the 2019–2021 NFHS, these coverage levels had increased substantially to 87.7%, 92.8%, 86.9%, and 80.5%. Increases in postnatal care coverage can in part be attributed to the role that Accredited Social Health Activists (ASHAs) play in providing home-based newborn care.
Figure 13: Postnatal care coverage trends in India’s higher mortality state cluster

Disaggregating risk factors for neonatal mortality yields insights into socioeconomic and demographic groups that have experienced rapid progress
Increased coverage of proximate interventions and shifts in contextual factors like fertility are linked to India’s NMR and MMR reductions. Studying disaggregated neonatal mortality trends can also shed light on how equity gaps between socioeconomic and demographic groups have closed—and contributed to overall progress. By assessing relative risks and the prevalence of risk factors over time, we can assess where and for whom India’s higher mortality state cluster has been most successful in reducing NMR. These insights can shed light into which populations have experienced the most rapid progress and which risk factors have been key in spurring progress.
In recent decades, India has seen several broad shifts in distal and intermediate factors that influence maternal and neonatal health alongside improvements in coverage and quality of key interventions. Through this analysis, we can calculate a population attributable fraction (PAF) for a series of factors, representing the proportion of neonatal mortality attributable to each specific risk factor. Trends in PAFs over time can be linked to both a change in the relative risk of that factor and a change in the composition of that factor. Linking back to this study’s conceptual framework, the factors considered in this analysis comprise proximate indicators mentioned earlier such as ANCq coverage and place of delivery, contextual factors related to fertility such as age at birth, previous birth interval, and birth order, as well as individual assessments of intermediate and distal factors such as urbanicity, religion, wealth, and education.
In the 2005–2006 NFHS the factors with the highest levels of attributable neonatal mortality in the higher mortality state cluster were identified as lack of high-quality ANC (31.1% of neonatal deaths), low household wealth (25.5% of neonatal deaths), short birth interval (25.5% of neonatal deaths), Hindu religion (16.9% of neonatal deaths), residence in a rural area (15.4%), and lower levels of maternal education (13.6% of neonatal deaths) (see Figure 14 below). Births in these categories were respectively found to be 1.6, 1.5, 2.2, 1.2, 1.2, and 1.2 times more likely to result in neonatal mortality.
In the 2019–2021 NFHS, neonatal mortality could similarly be attributed to several of these factors. For example, the percentage of neonatal mortality attributable to low household wealth decreased only slightly from 25.5% to 21.7%. The percentage of neonatal mortality attributable to residence in a rural area increased slightly from 15.4% to 20.3%. The relative risks for mortality remained nearly equal over time for these groups, and the portion of the population in the higher mortality state cluster that were in these risk groups remained relatively similar—especially compared to trends seen in the lower mortality state cluster. The fraction of people in rural areas decreased marginally from 82.1% to 81.9%, whereas the proportion of people in the poorest tertile (third)—as defined by wealth thresholds from the 2005–2006 NFHS—decreased more substantially, from 65.2% to 46.1%.,
Other factors such as maternal education and birth interval saw substantial decreases in attributable neonatal mortality over time. By the 2019–2021 NFHS, 7.1% and 16.9% of neonatal deaths were respectively attributable to lower levels of maternal education and short birth intervals.
The proximal factor that experienced the most substantial decrease in attributable neonatal mortality over time was high-quality ANC. In the 2005–2006 NFHS, 31.1% of neonatal mortality could be attributed to lack of high-quality ANC, whereas in the 2019–2021 NFHS only 6.3% of neonatal mortality could be attributed to lack of high-quality ANC. Between these two surveys, coverage of high-quality ANC improved from 23.9% to 79.5%.,
The increasing trend for institutional delivery likely reflects endogeneity biases—as in the 2005–2006 NFHS, the relative risk for institutional delivery was higher than the relative risk for home deliveries. As such, a negative percentage of neonatal deaths were attributable to home delivery, and these results should be interpreted with caution. At the time of the 2005–2006 NFHS, only 22.9% of deliveries occurred at home, and there is a large body of evidence that in settings with low institutional delivery rates, the risk profiles of births in those facilities tends to be higher—as mothers with complications tend to disproportionately seek facilities for birth. The findings related to high-quality ANC suggest that provision of high-quality maternal care has been an essential contributor to neonatal mortality reductions in the higher mortality state cluster.
Select factors within this analysis should be interpreted with caution, as differences in neonatal mortality were not statistically significant between groups. NMR between the Hindu and non-Hindu groups was not found to be statistically significant in either the 2005–2006 NFHS or the 2019–2021 NFHS. Other factors—urban/rural residence, caste, ANC coverage/quality, and institutional delivery—did not show statistically significant differences in NMR for the baseline 2005–2006 NFHS, but did for the endline 2019–2021 NFHS, limiting the interpretability of trends over time between the two surveys.