Poverty, agriculture, and food security
Poverty reduction, agricultural development, and food security are tightly linked in heavily agricultural economies like Uganda’s, where more than 70 percent of the population is employed in agriculture. When small farmers earn more, poverty tends to fall. When poverty falls, food security tends to rise because people have more money to spend on food. One World Health Organization official put it plainly: “If household income improves, stunting will reduce. If they get more money, children’s lives will improve.” Many Ugandans grow or raise the food they eat, and in those cases, of course, the link between agricultural development and food security is direct.
Between 2002 and 2016, Uganda’s extreme poverty rate (< US$1.90 per day) dropped 25 percentage points, from 66 percent to 41 percent. The 2002 rate of 66 percent was significantly higher than the sub-Saharan African average, but the 2016 rate of 41 percent is exactly average for the region, demonstrating that progress against poverty during this period happened faster in Uganda than in most of its peer countries, although an extreme poverty rate above 40 percent is still a concern.
Despite the steep drop in poverty between 2002 and 2016, poverty rates started increasing slightly after 2013, an indication that these gains may not be durable. In fact, many of the people escaping poverty in Uganda remain vulnerable. According to a 2016 report, 40 percent of the households that escaped poverty between 2005 and 2009 were again living in poverty by 2011. In 2012–2013, as many as 14.7 million Ugandans could be numbered among the “insecure non-poor,” which means they lived at an income level that was less than twice the poverty line.
Additional Reading
Moreover, the distribution of poverty across the country is uneven, with much higher concentrations in the Northern and Eastern regions. According to the national poverty indicator (which is different from the global extreme poverty indicator), the poverty rates in Northern and Eastern Uganda in 2017 were 33 percent and 36 percent, respectively, while the rates in the Western and Central regions were just 11 percent and 10 percent.
Much of Uganda’s progress toward reducing poverty is due to macroeconomic success. Between 2000 and 2016, per capita GDP (PPP constant 2017 international$) has nearly doubled, reflecting a longer trend of economic growth since the National Resistance Movement took over the government. According to the publication, Growth and Poverty in Sub-Saharan Africa, “This growth has been attributed to the government that has implemented a far-reaching economic reforms agenda, transforming Uganda into one of the most liberal economies in Africa south of the Sahara.” Growth has not necessarily been equally distributed or focused on the poor, but eventually it does reach the poor, and when it does, it tends to increase their standard of living and lift them above the poverty line.
Some of Uganda’s success in poverty reduction is the result of anti-poverty programs led by governments and donors. Given the concentration of poverty in the north, the government, with help from the World Bank, created the Northern Uganda Social Action Fund (NUSAF) in 2002. The program initially provided employment opportunities, livelihood support, and community infrastructure rehabilitation in 18 districts in Northern Uganda, and has since expanded to cover 62 districts. In 2010, the government implemented the Social Assistance Grants for Empowerment (SAGE) program, which began by providing targeted cash transfers to the poorest 10 percent of the population across 15 districts and later expanded to cover 40 districts. However, SAGE and NUSAF, the two main anti-poverty programs, still reach only 3 percent of the population and account for only 0.14 percent of the GDP (as of 2017–2018).
Labor migration has also contributed to poverty reduction. In 1999, remittance inflows totaled US$233 million, and by 2019, they had quintupled to almost US$1.3 billion, accounting for 4.2 percent of the country’s total GDP. Remittances play an especially important role in poverty reduction in Uganda’s growing urban areas. In 2018, urban households represented 85 percent of remittance-receiving households.
Although anti-poverty programs and remittances help, they are not large enough to be the main drivers of the poverty reduction Uganda has seen in the past two decades. To fully understand these changes, it is important to look at shifts in the agricultural economy.
Households whose livelihoods depend on agriculture accounted for 79 percent of the national poverty reduction from 2006 to 2013, which is not surprising, since 70 percent of the population depends on agriculture for survival. Counterintuitively, although rural populations have driven poverty reduction, productivity in the agricultural sector has stagnated. National agricultural output has grown by only 2 percent for the past five years, and for the past 20 years, the ratio between outputs and inputs (total factor productivity) has been negative, indicating that less output is resulting from the same or greater effort. Given these trends in productivity, how did rural poverty decline so significantly?
One answer is increasing agricultural specialization, with growers of cash crops, especially coffee farmers, escaping poverty at higher rates than others. Similarly, many farmers have shifted toward livestock production. The crop production index dropped slightly between 2000 and 2016, whereas the livestock production index nearly doubled.,
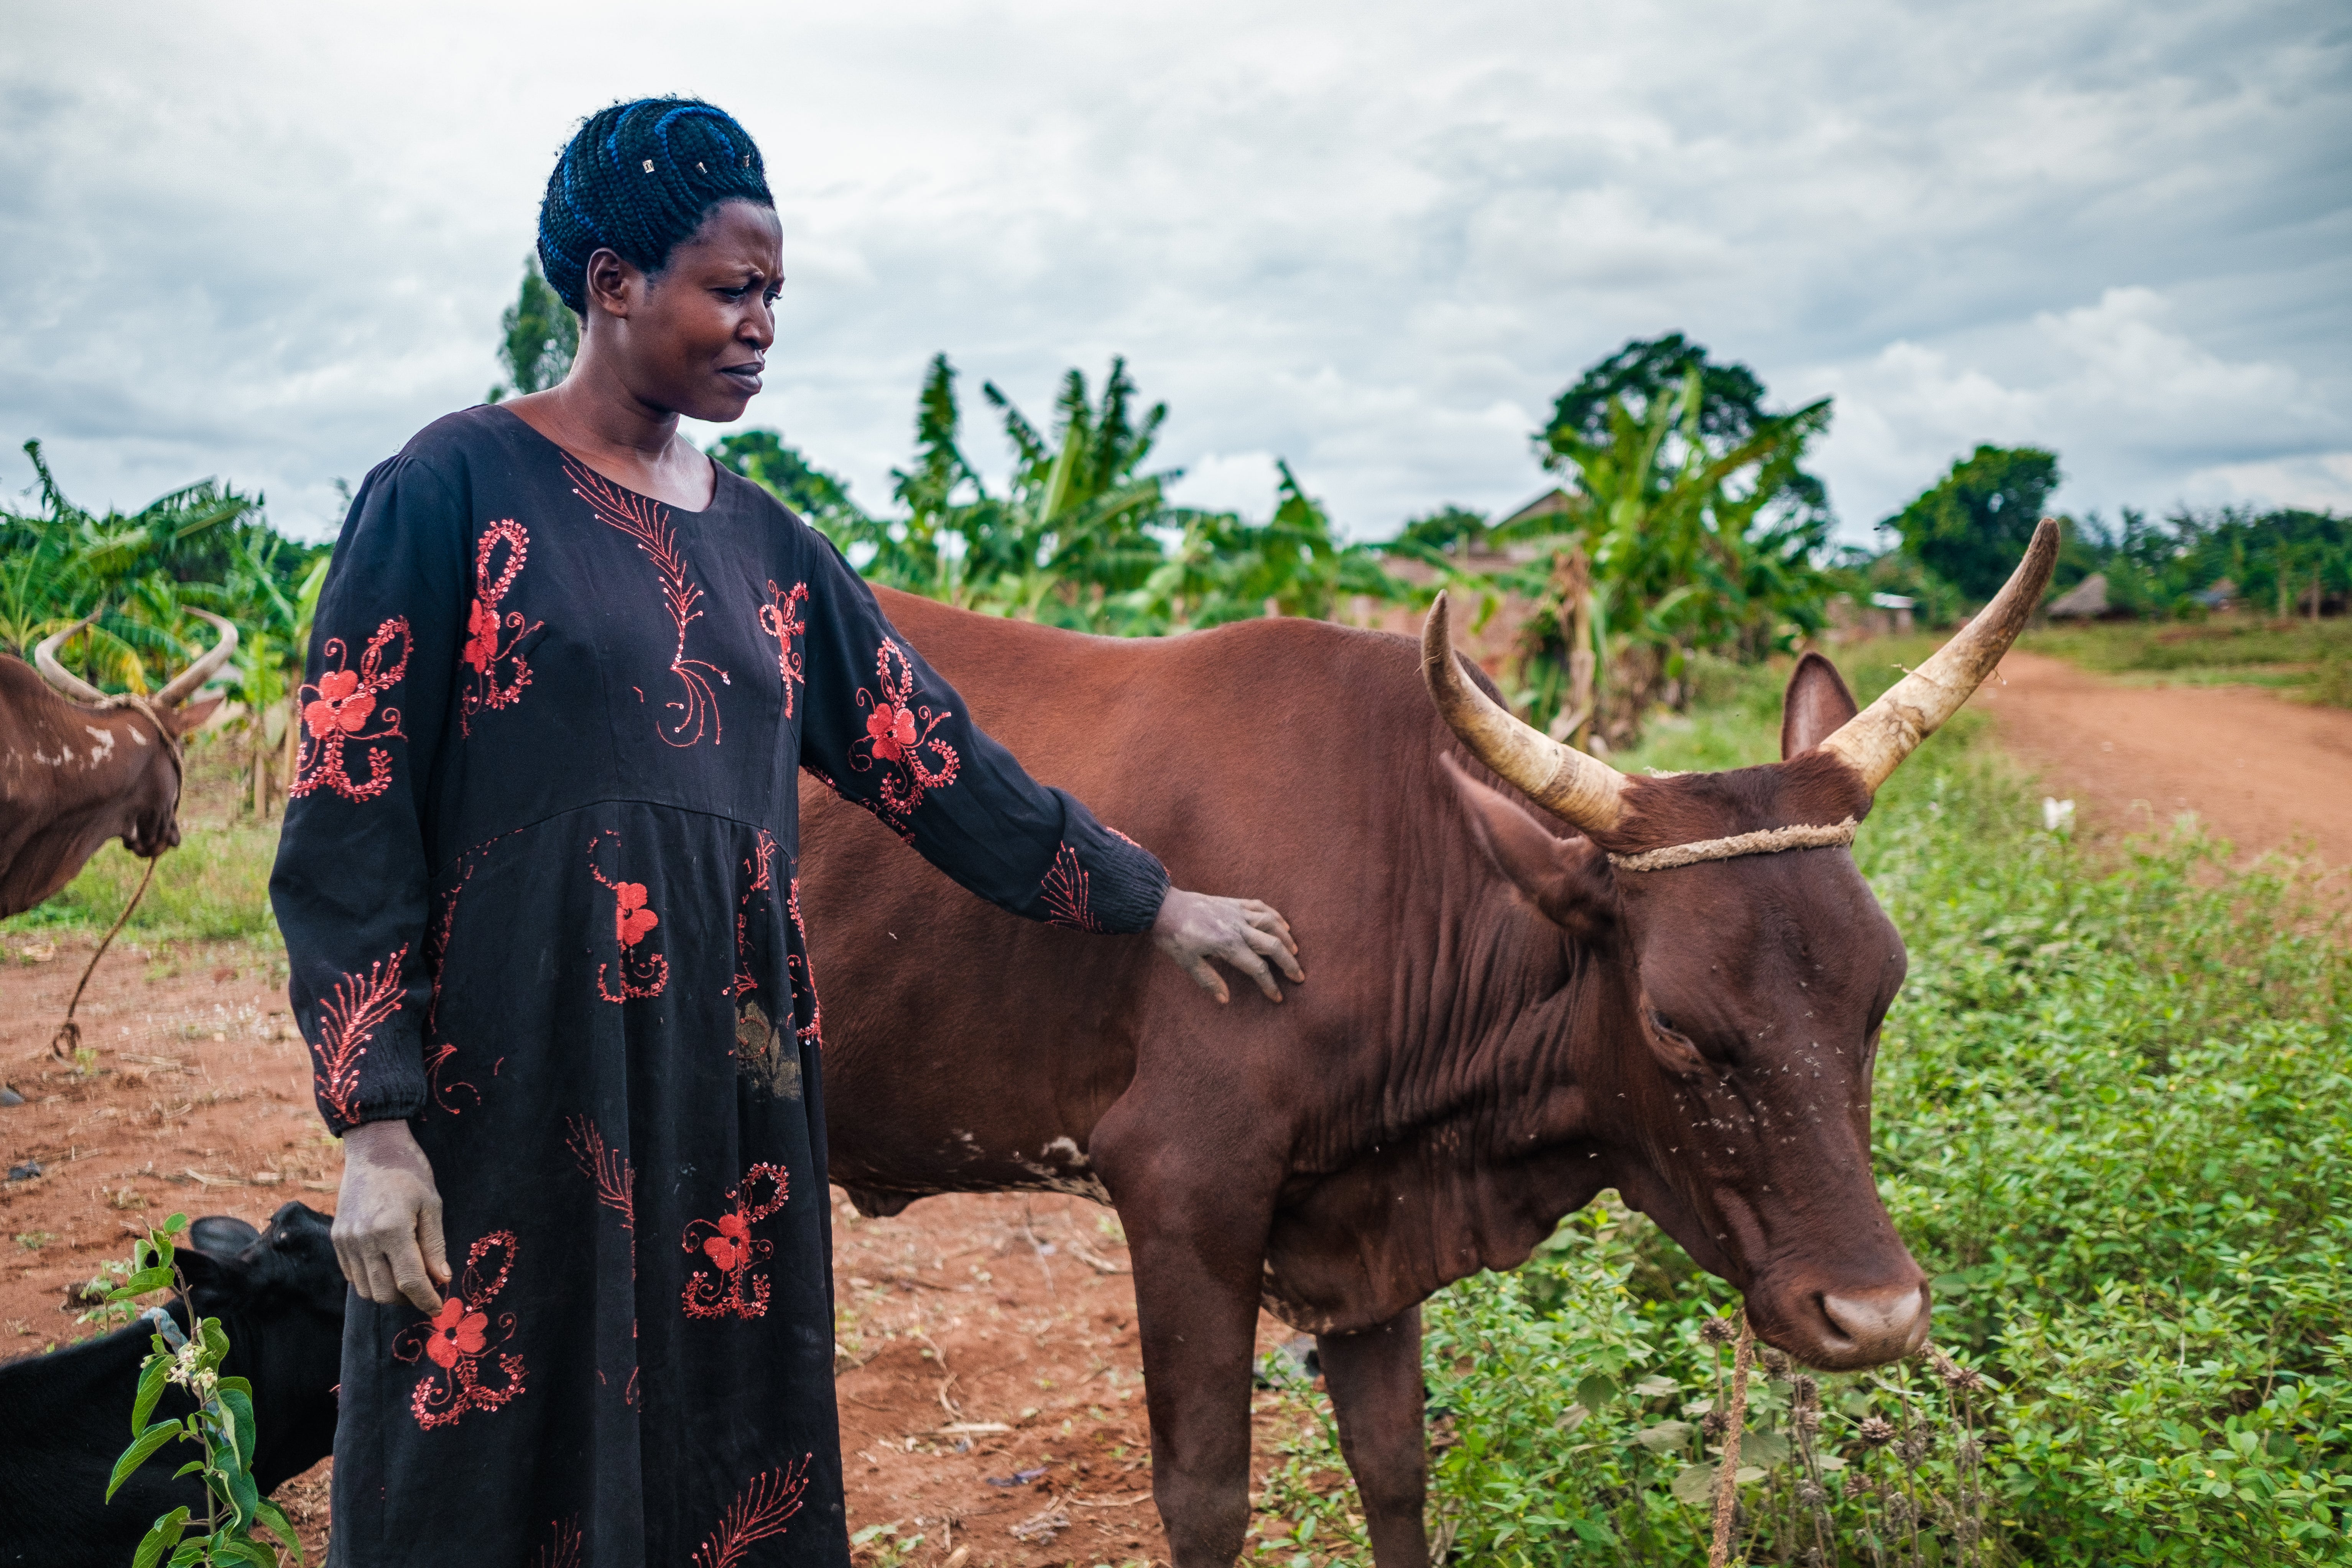
Another clear trend in agriculture is the diversification of rural household economies. Three-quarters of households still earn some income from agricultural production, but less than half identify it as their most important income source, and only one-quarter rely on agriculture exclusively. For the poorest households, self-employment in the informal sector can augment farm income and build resiliency against shocks.
Finally, as we will discuss in the next section, it is possible that the steep decline in the burden of malaria and HIV/AIDS supported the downturn in poverty rates. Since these diseases can keep adults from earning an income over long stretches and can drain families’ savings, the reduction in malaria and HIV/AIDS cases has contributed to the decline in poverty.
Nutrition-sensitive agricultural development for smallholder farmers is needed to maintain progress toward reducing poverty and stunting. Government spending on agriculture has increased in recent years,, but respondents in our qualitative research were not confident in recent policies because they felt that these policies focus on economic growth and are not inclusive of nutrition.
Health
Maternal, newborn, and child health
In 1999, Uganda developed the landmark National Health Policy to provide universal health coverage for basic services and implement cost-effective interventions that address the major causes of disease. Like most low-income countries, Uganda’s public health system struggles to provide high-quality care due to limited resources, especially in rural areas. According to a study of trends in malaria treatment, a slight majority of Ugandans seek care at private-sector facilities where quality of care can vary greatly.
In recent years, the government and development partners have been addressing the shortage of human resources with investments and policies. Between 2000 and 2016, the density of doctors, nurses, and midwives more than doubled,, and by 2016, 76 percent of positions within the health system had been filled. Much of this progress happened after 2010, when the Human Resources for Health Information System publicized data about the staff shortages, helping the Ministry of Health and civil society with their advocacy efforts and eventually leading to a vote in Parliament to increase funding. These investments brought much-needed resources to the Ugandan health system, and some of the resulting resiliency can be seen in Exemplars work that studied continuity of essential health services during the COVID-19 pandemic.
In 2001, the Village Health Team (VHT) program was launched to bridge the gap created by the health worker shortage and to improve equity in access to health services. VHTs, whose members serve on a volunteer basis and in most cases do paid work alongside their roles as VHTs, act as the first point of contact between people in communities and the health system, with a focus on mothers and children. They are the equivalent of “Health Centre 1” in a five-tiered health center system and are responsible for providing basic health education to community members and referring people to health centers for a higher level of care. Between 2001 and 2015, nearly 180,000 people were trained by the VHT program. All levels of respondents have echoed the importance of VHTs in improving the health and nutritional status of children. “Preventive health services have been strengthened by the VHT strategy,” said a respondent from the World Health Organization. “They are able to quickly detect children who are sick or malnourished and they refer them to the health center or hospital for appropriate management.”
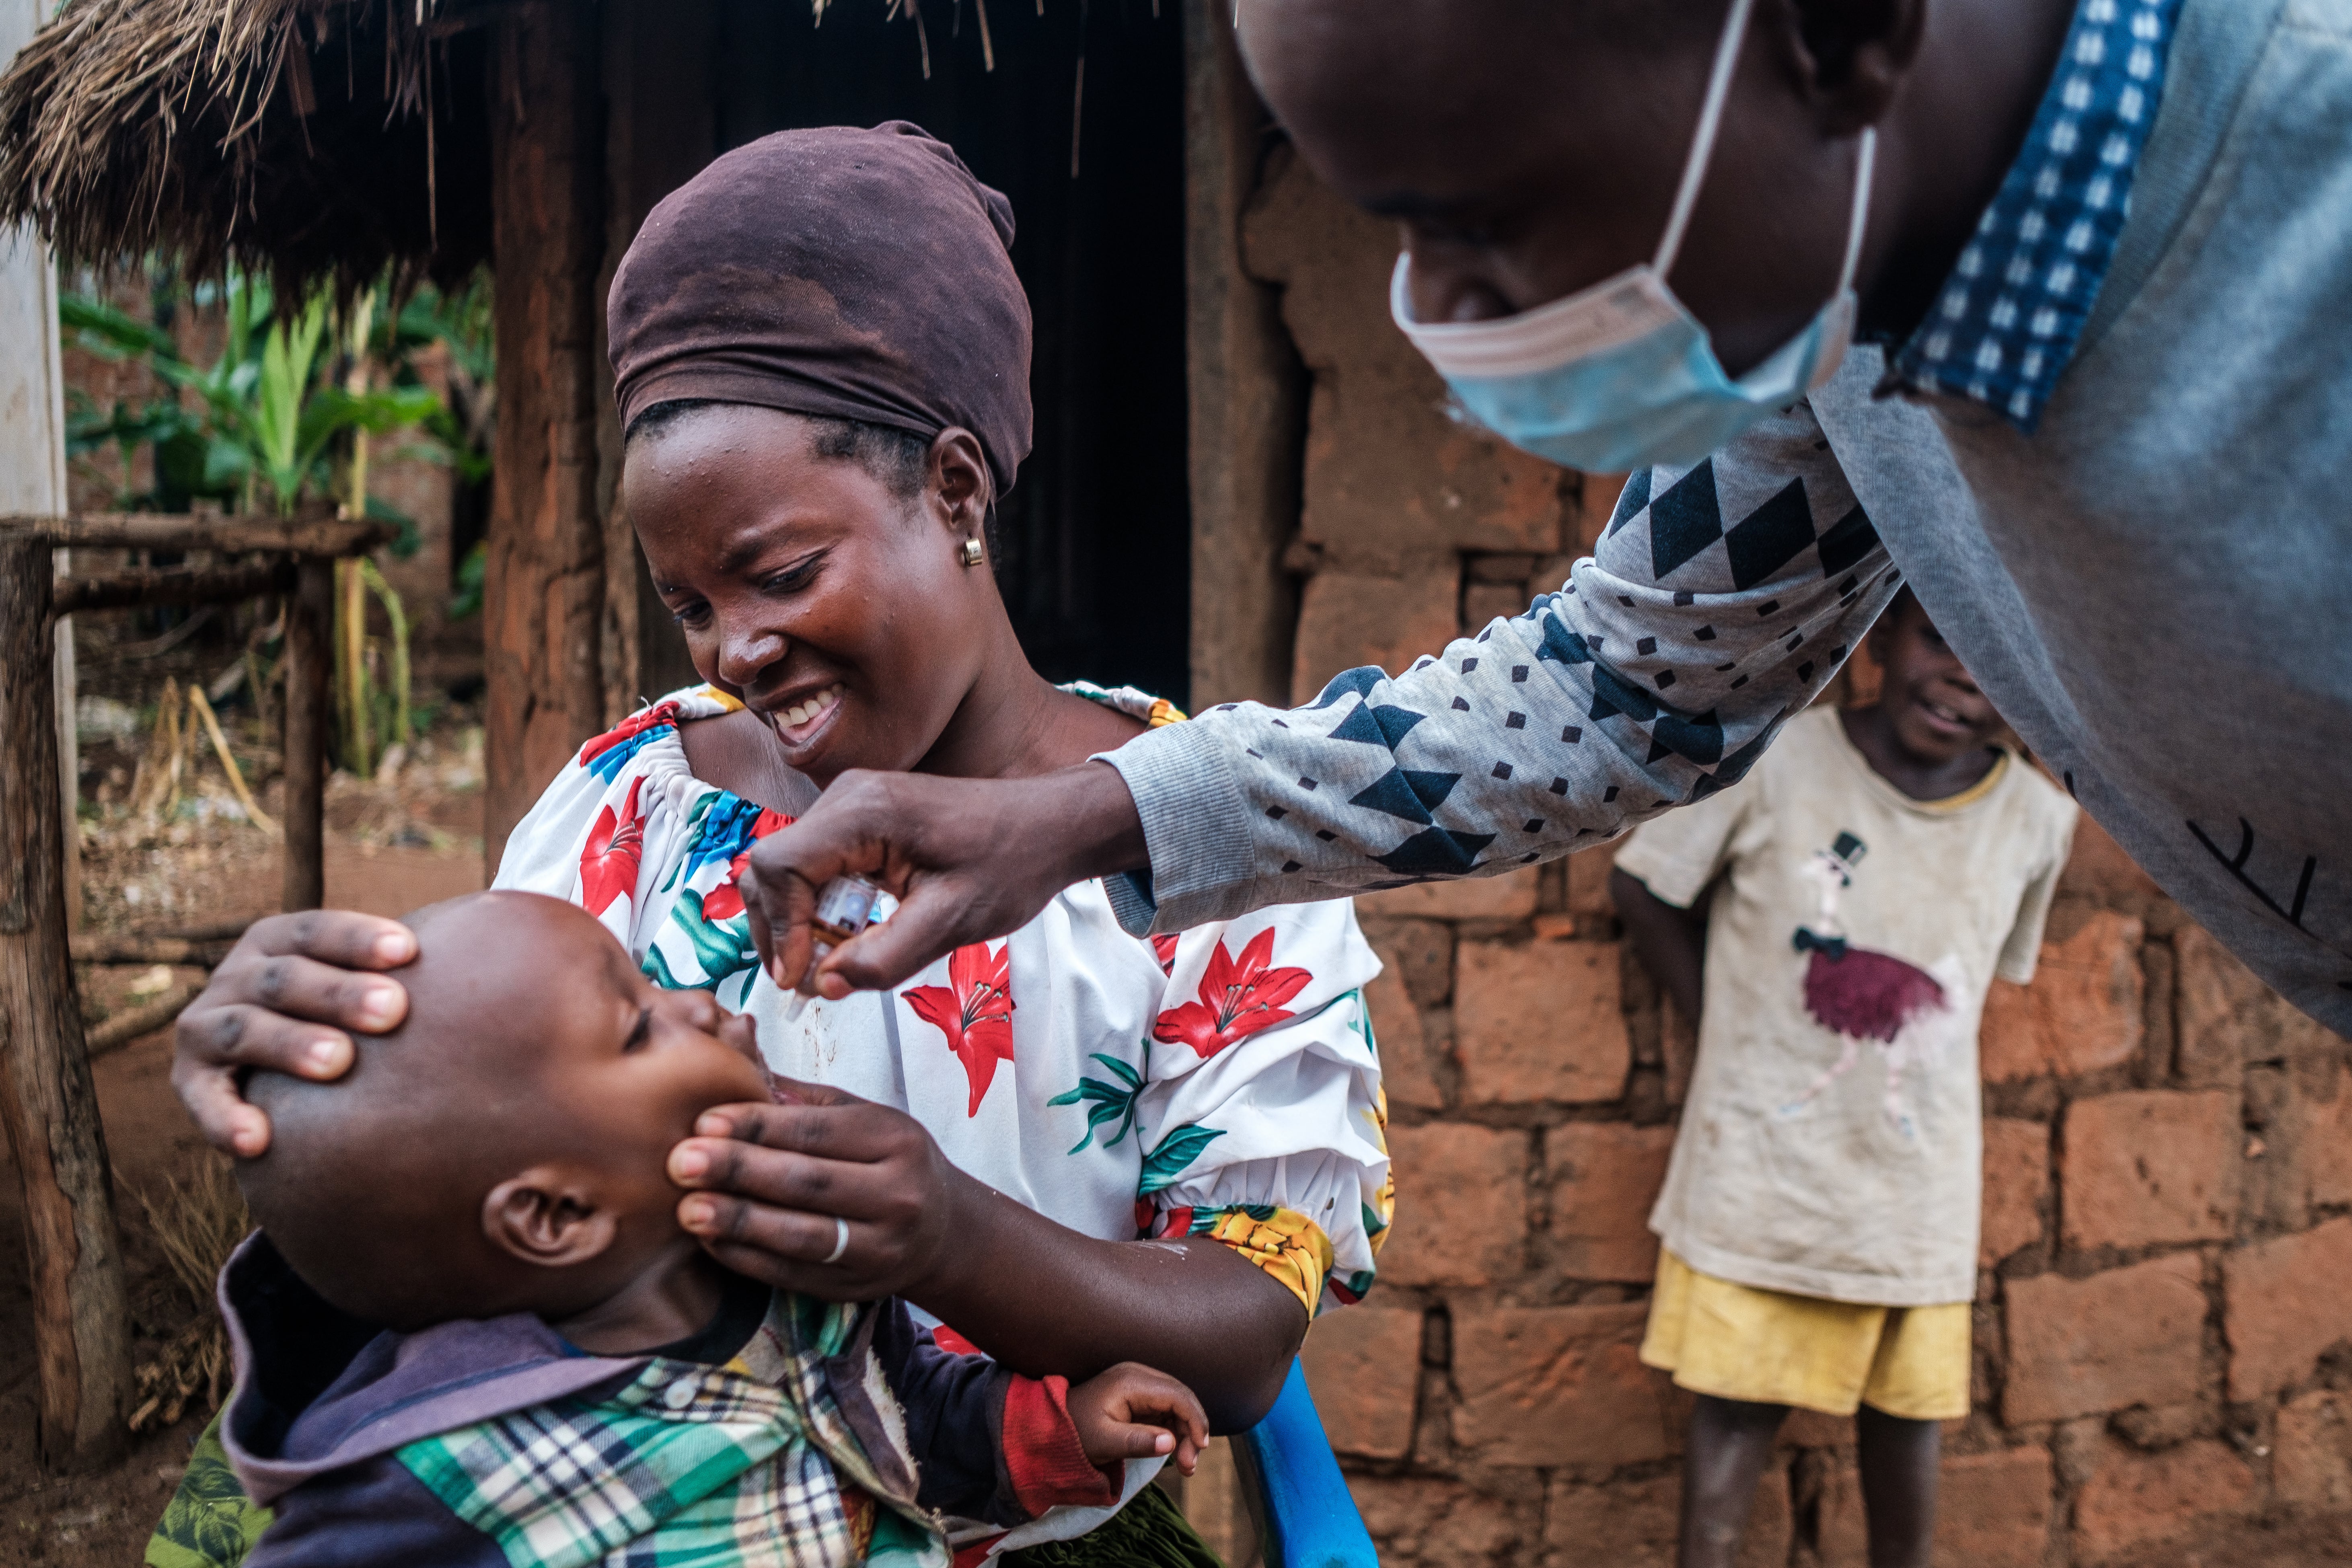
Nevertheless, the program has faced its share of challenges. According to the Ministry of Health, about one-third of those trained as VHTs have left the program, in large part due to limited resources: stockouts of medicines, a shortage of basic supplies like rubber boots, and a lack of funds to cover transportation costs.
In recent years, the Ministry of Health has proposed the development of the Community Health Extension Workers (CHEW) Program, a smaller cadre of more highly trained, paid frontline workers to provide additional services and supervise the VHTs. Before COVID-19 disrupted the health system, the CHEW program aimed to deploy 15,000 paid workers across 7,500 parishes by the end of 2020. However, because of the pandemic, the CHEW program has yet to be rolled out.
As a result of these health reforms and the steady strengthening of the health system, maternal and child health indicators improved significantly between 2000 and 2016. The child mortality rate dropped by two-thirds, from 148 deaths per 1,000 live births to 51, and the maternal mortality ratio dropped by one-third, from 578 deaths per 100,000 live births to 381. The proportion of women making four or more prenatal visits rose by almost a third, from 42 percent to 60 percent, , and women who received skilled delivery care doubled, increasing from 36 percent to 74 percent.
According to our decomposition analysis, these improvements contributed significantly to the decline in stunting. Maternal and newborn health care accounted for 11 percent of the growth improvements seen in children under five in Uganda.
Malaria
In the mid-2000s, with a surge in financial support from two donor-funded programs (the Global Fund to Fight AIDS, Tuberculosis and Malaria and the President’s Malaria Initiative), in addition to other national policymaking and programming, Uganda started making rapid strides in reducing malaria. Malaria has always been a serious health issue in Uganda. In 2021, the country globally ranked fifth in the number of malaria deaths and third in reported malaria transmission rates.
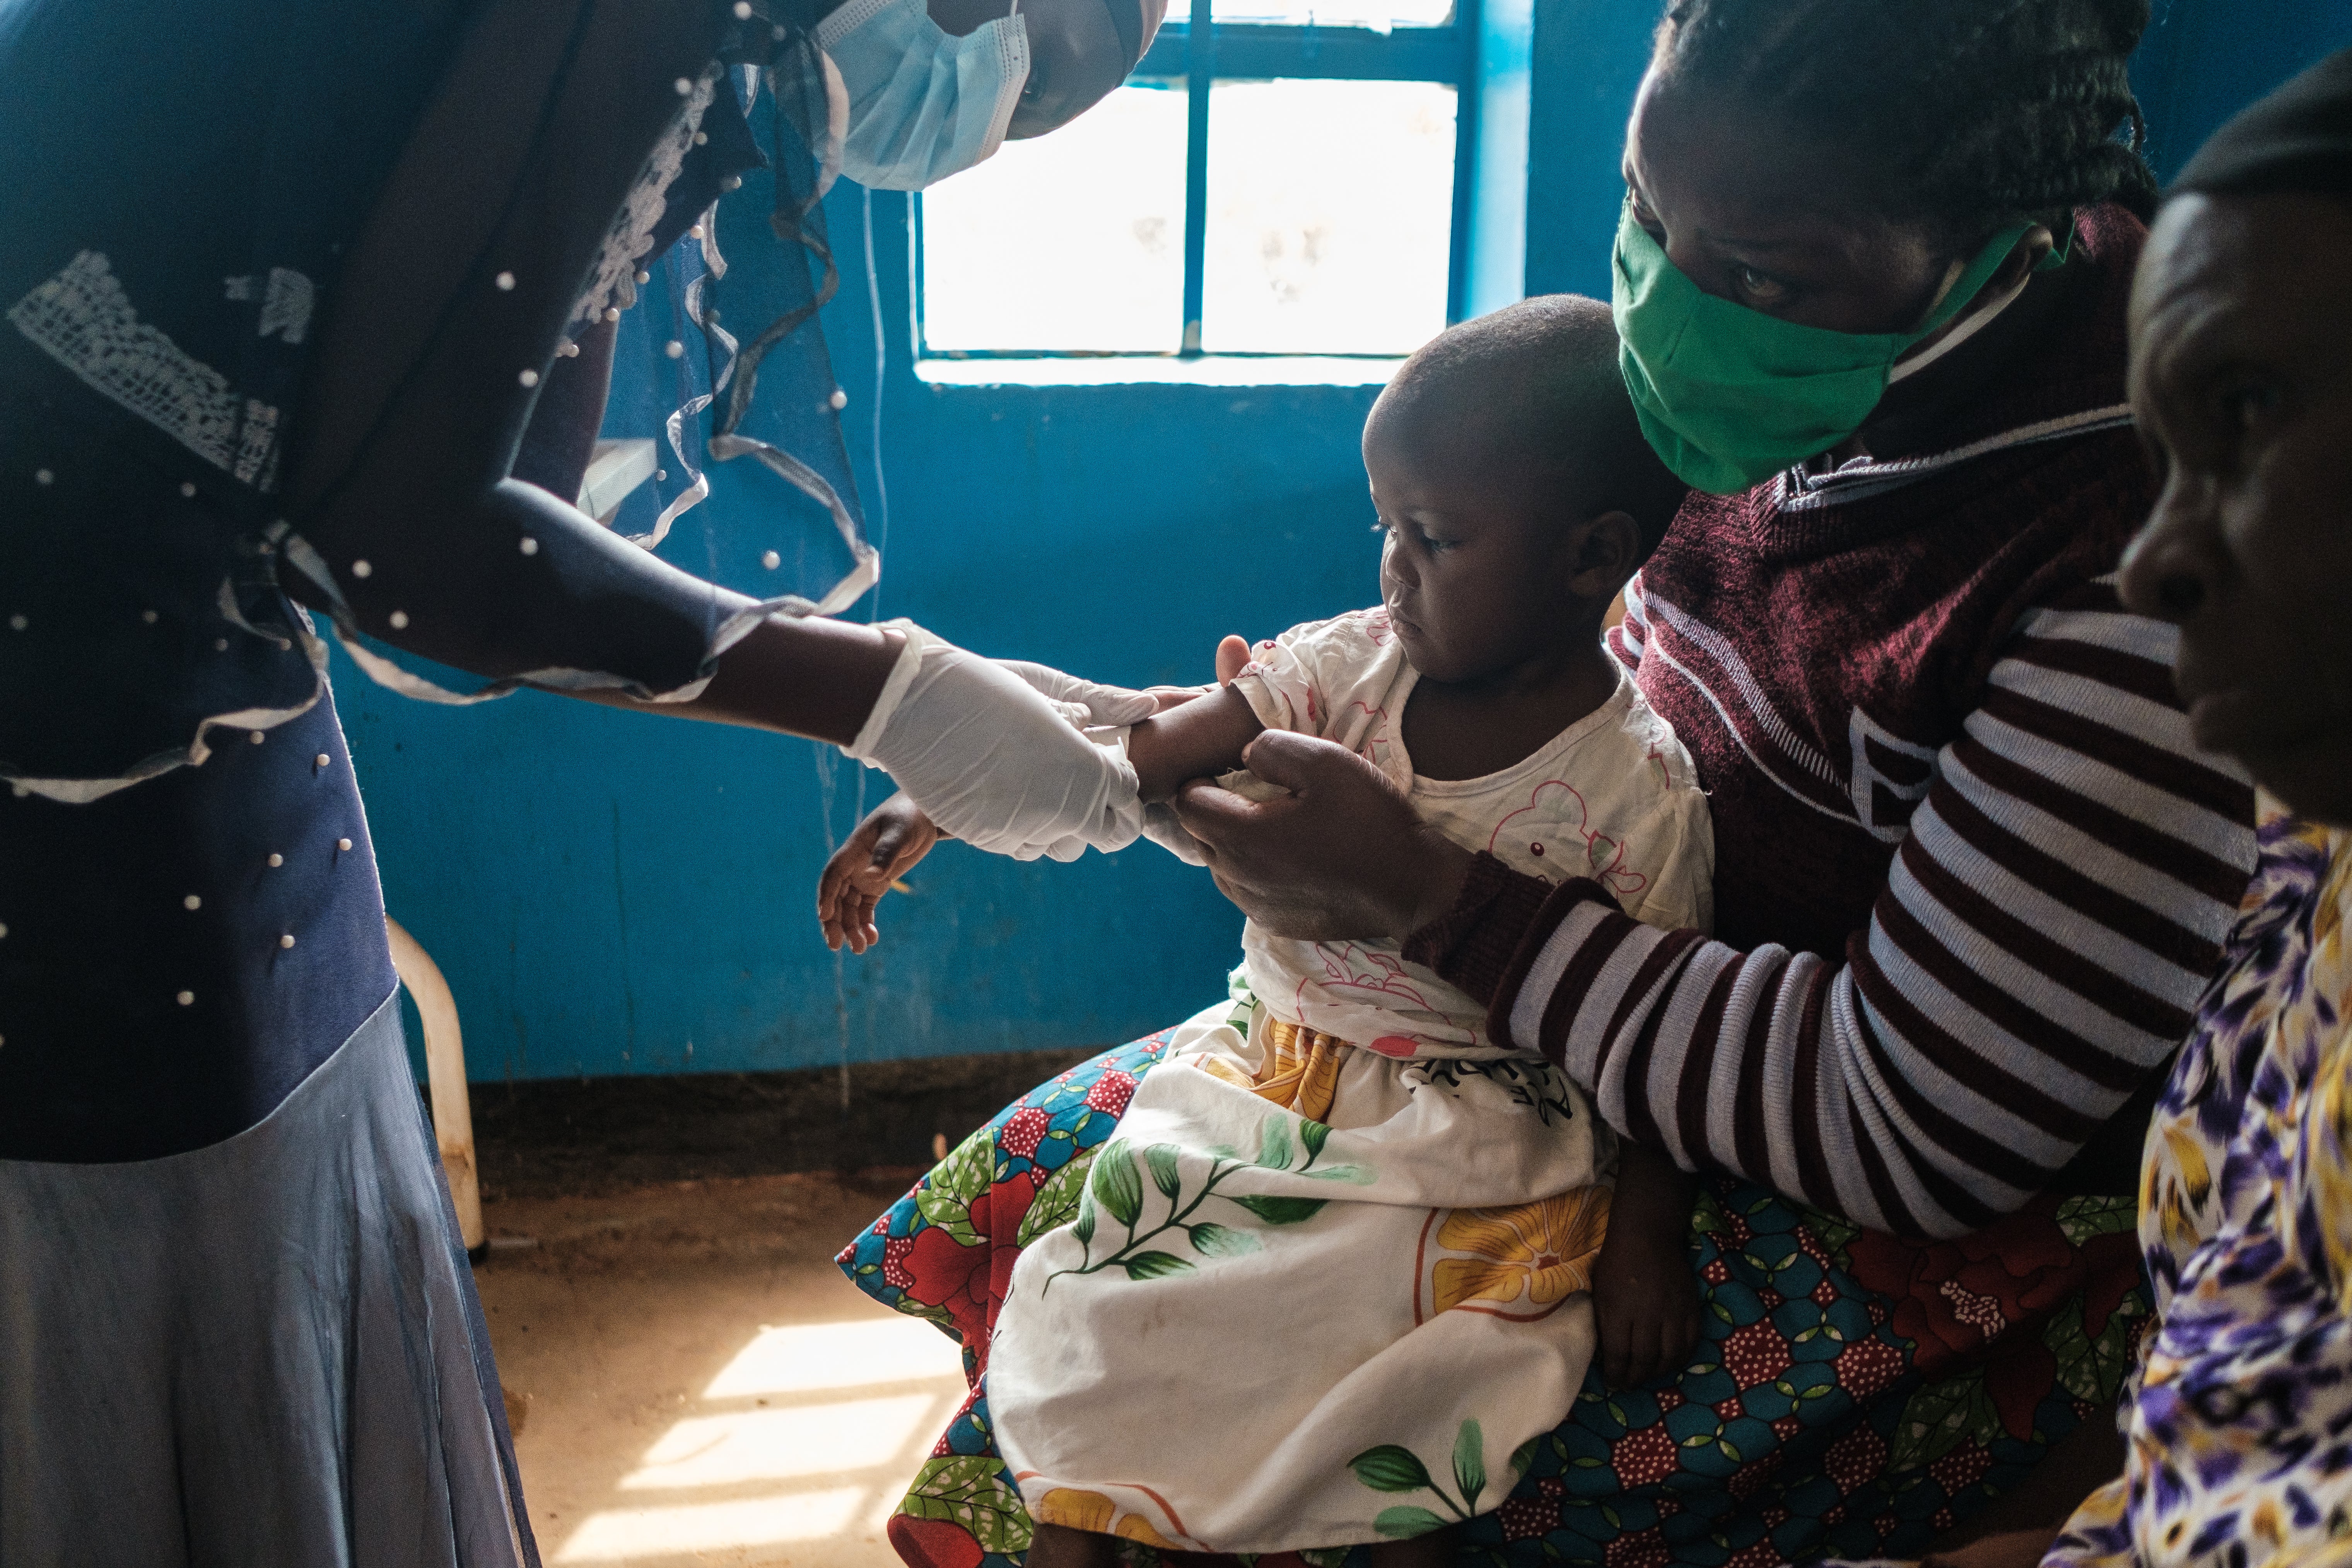
Between 2009 and 2014, the percentage of households with at least one malaria net doubled in just five years, and the malaria burden dropped by approximately half (a little more or a little less depending on whether the indicator is microscopy-confirmed cases or rapid-diagnostic-test confirmed cases). During this same period, the percentage of children who received artemisinin-based treatment more than tripled., Improvements have remained steady more recently — possibly due to challenges with sustaining behavior change—but the situation is substantially better than a decade ago.
In the global literature, the impact of malaria reduction on stunting is highly contextual. In our decomposition analysis, 30 percent of the growth improvements among children under five can be attributed to the presence of bed nets in households. Bed nets are the most important antimalarial intervention in Uganda in our model. They also serve as a proxy for improvements across a host of interventions, including indoor residual spraying, intermittent preventive treatment in pregnancy, treatment with artemisinin-based combination therapies, integrated case management, and improved diagnostics.
Additional Reading
Association between interventions and malaria prevalence in Uganda, 2006-2021

Given the large effect of bed nets reflected in our research and other high burden settings, the role of malaria control in stunting reduction programs is starting to become clearer. Although it is too early to say precisely why the decline of malaria in Uganda contributed to the decline in stunting, we can offer some hypotheses:
- First, because malaria infections in pregnant women lead to smaller babies, controlling infections during pregnancy may have led to longer and heavier babies at birth. Indeed, our analysis of the child growth curves show that birth size increased steadily during the study period.
- Second, young children are especially susceptible to malaria, and the decline in infections may have eliminated one cause of growth faltering after children are born.
- Third, because the burden of malaria is so high in Uganda, caring for those suffering from the illness can deplete families’ income and savings and lead to poverty. The drop in malaria, alongside efforts to reduce the cost of high-quality treatment, could therefore lead to lower poverty rates, which is connected to improved food security and lower stunting rates.
Political support and nutrition governance
In recent years, the Ugandan government and donors active in the country have started focusing on nutrition as a development priority. In 2007, in response to high levels of micronutrient deficiency, specifically iron deficiency anemia, the Strengthening the National Food Fortification Program was created. The program fortifies vegetable oil, maize flour, and wheat, although respondents noted that the poorest households may be unable to afford wheat flour.
In 2011, Uganda also joined Scaling Up Nutrition (SUN), an international, multisectoral collaboration that aims to end all forms of malnutrition by 2030. As part of its participation in SUN, Uganda established the Uganda Nutrition Action Plan (UNAP), which all national and district respondents called a critical platform for the coordination of nutrition-related activities across sectors. According to one interviewee from academia, “now all stakeholders recognize that nutrition is not a one-sector show like Ministry of Health, but all line sectors have to get on board.”
Alongside the development of UNAP and UNAP II, Uganda has also created national-level coordinating bodies like the UNAP Secretariat and the Multisectoral Nutrition Technical Coordination Committee in addition to District Nutrition Coordinating Committees for subnational planning and implementation. These institutions have their distinct roles but share an overall purpose to mainstream the goals of the Nutrition Action Plan in partnership with development partners, the private sector, and community social organizations.
Overall, national-level respondents have said the policy environment is receptive to nutrition, with nutrition being integrated into many recent national development documents, including the Uganda Vision 2040 and the National Development Plan.

Respondents also reported that there was no specific financing for nutrition in the national budget and that the Ministry of Health nutrition budget is not always given priority. Moreover, donor financing tends to be specific to vulnerable regions or populations, especially Karamoja and refugee settlements. With proper budgeting, strengthened inter-agency coordination mechanisms, harmonized guidelines, and further emphasis on monitoring and evaluation, we hope to see improvements in implementation of nutrition policies and strategies moving forward.
Education
Parental education, especially maternal education, has consistently been shown to be a driver of improved child health and nutrition. “Educating a girl child is the number one direction to reducing stunting,” said one respondent from Makerere University. Better-educated parents tend to earn more and know more about health and nutrition, which leaves them with more resources to devote to their children and a better understanding of how to do so. In addition, mothers with higher levels of education are more likely to be empowered to make decisions about how the family will spend money and rear children, and fathers with more education are more likely to accept women in decision-making roles.
Another reason maternal education can lead to reductions in stunting is that girls who stay in school longer tend to have fewer children and to have children later in life. In Uganda, the age at first marriage increased slightly from 17.8 years old in 2000 to 18.9 years old in 2016; the total fertility rate declined from 6.9 births in 2000 to 5.4 births in 2016; child marriage, or the proportion of women 20-24 years old who had married by age 18, decreased from 54 percent in 2000 to 34 percent in 2016; and the adolescent fertility rate declined from 167 births per 1,000 girls in 2000 to 132 births per 1,000 girls in 2015. , These changes make a difference in two ways. Biologically, adult mothers who are pregnant less often are healthier, stronger, and more prepared for the rigors of pregnancy and childbirth, which means their children tend to be healthier, stronger, and taller. Moreover, mothers with fewer children have more resources to devote to each child.
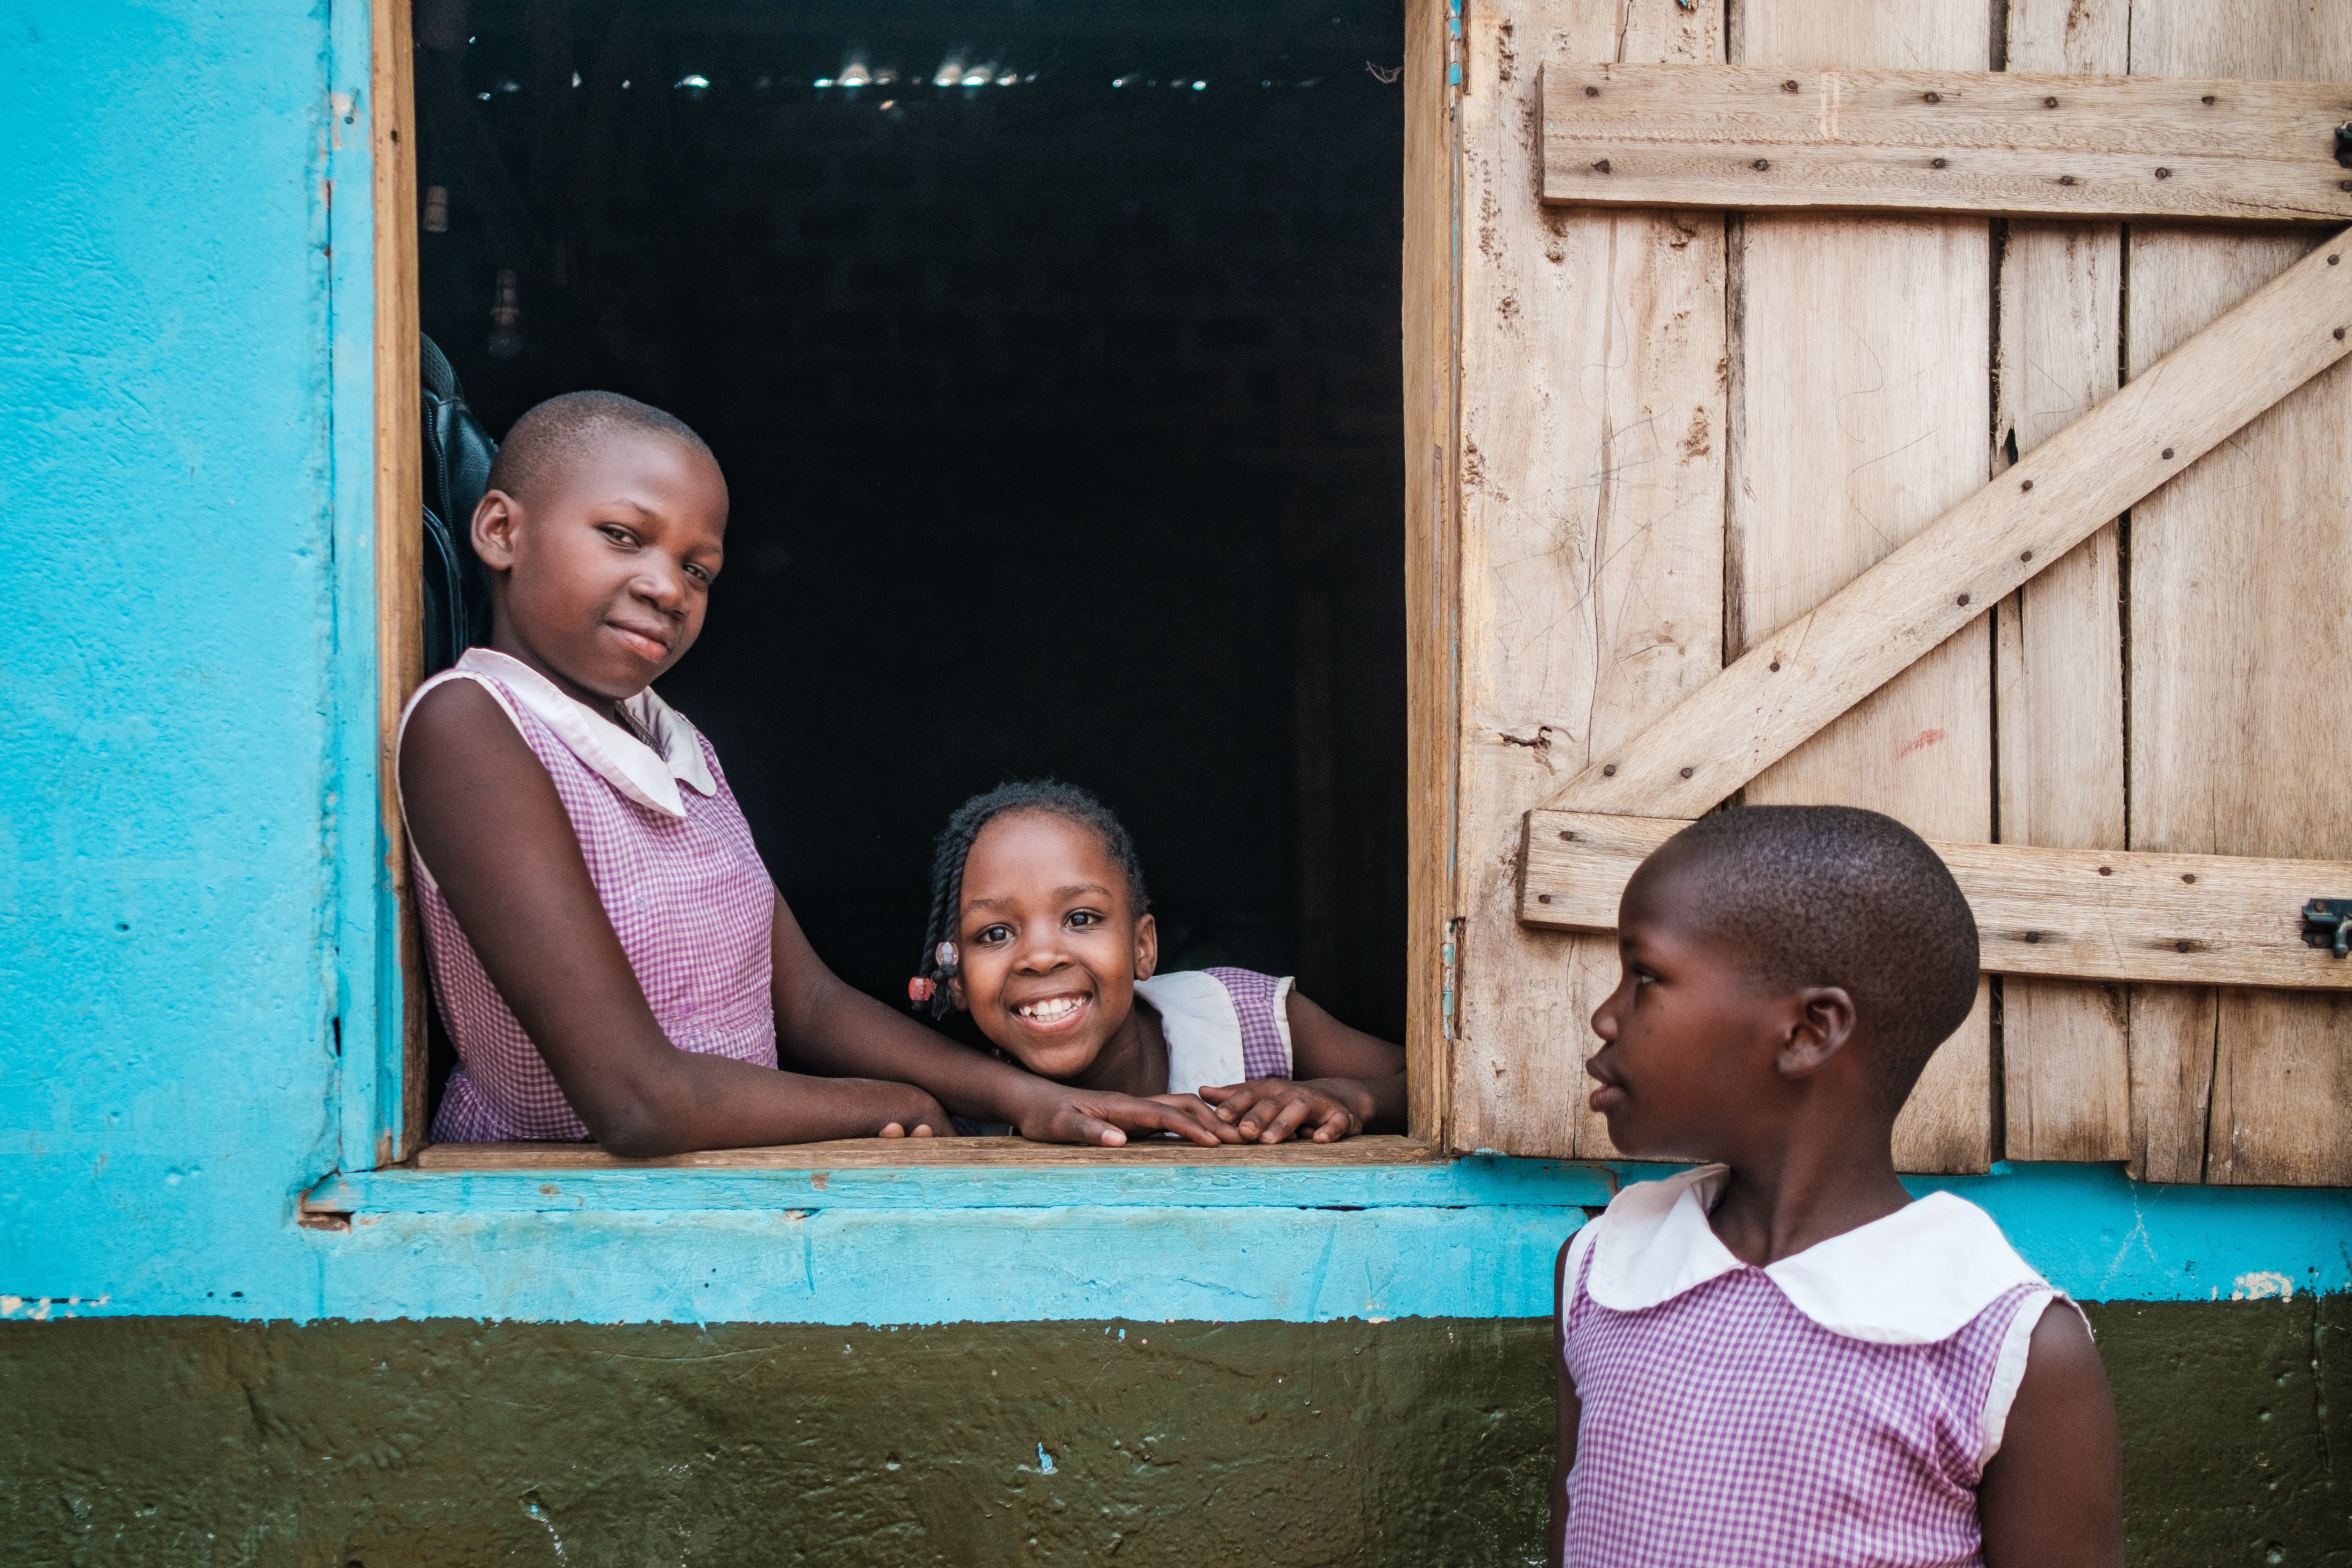
Our Uganda research is consistent with these findings. Our decomposition analysis showed that increased paternal education accounted for 6 percent of the growth improvements for children under five, while increased maternal education accounted for 17 percent. Results from our equity analysis also showed that children of mothers with secondary or higher education are much less likely to be stunted compared with children of mothers with lower education levels. While the qualitative work largely corroborated these findings, some respondents mentioned that higher maternal education has complicated proper breastfeeding because women with higher education levels are more likely to work outside the home, where they tend to lack support for breastfeeding.
When Uganda’s government began to stabilize in the mid-1990s, education was one of its first priorities. Created in 1997, the Universal Primary Education program eliminated tuition fees for public primary education. At the same time, the government boosted financing for education (from 2.1 percent of the GDP in 1995 to 4.8 percent of the GDP in 2000, and from 13.7 percent of the national budget in 1990 to 24.7 percent in 1998). This increased spending funded the construction of 5,000 primary schools and the hiring of more than 64,000 primary school teachers between 1996 and 2003. In this same time span, primary school enrollment more than doubled, rising from 3.1 million to 7.6 million students. At the same time, gender parity improved, reaching 95 percent in 2004, up from 85 percent in 1997. The surge in enrollment led to challenges, however, including very high dropout rates and under-qualified teachers. The 2004 Education Sector Strategic Plan was designed in part to address these weaknesses.
Even after the primary school system improved, rates of student retention between primary and secondary school remained low, at just 23 percent in 2006. In response, the government implemented the Universal Secondary Education program in 2007. Uganda was the first country in sub-Saharan Africa to introduce universal secondary education by guaranteeing free secondary education in public schools and participating private schools to students who meet standards on primary school exit exams.
Within a year of the plan’s implementation, the proportion of students who enrolled in secondary school upon finishing primary school rose from approximately 50 percent to almost 70 percent. As was the case with universal primary education, quality did not scale up as quickly as quantity, and the focus recently has shifted from enrollment to learning.
Recent quantitative data on the impact of these programs on learning is sparse, but steady improvement in literacy rates suggests the country’s overall progress in education. In 1990, the literacy rate among 15- to 24-year-olds was 70 percent. By 2018, it was 90 percent, with young women very slightly more likely to be able to read and write than young men.
Water, sanitation, and hygiene
Water, sanitation, and hygiene (WASH) indicators in Uganda have been steadily improving over time, but they started from a very low base, and with the current trajectory, it will still be many years until the entire population has access to high-quality WASH products and services. Therefore, WASH is both a factor in Uganda’s recent success and a priority area for continued development.
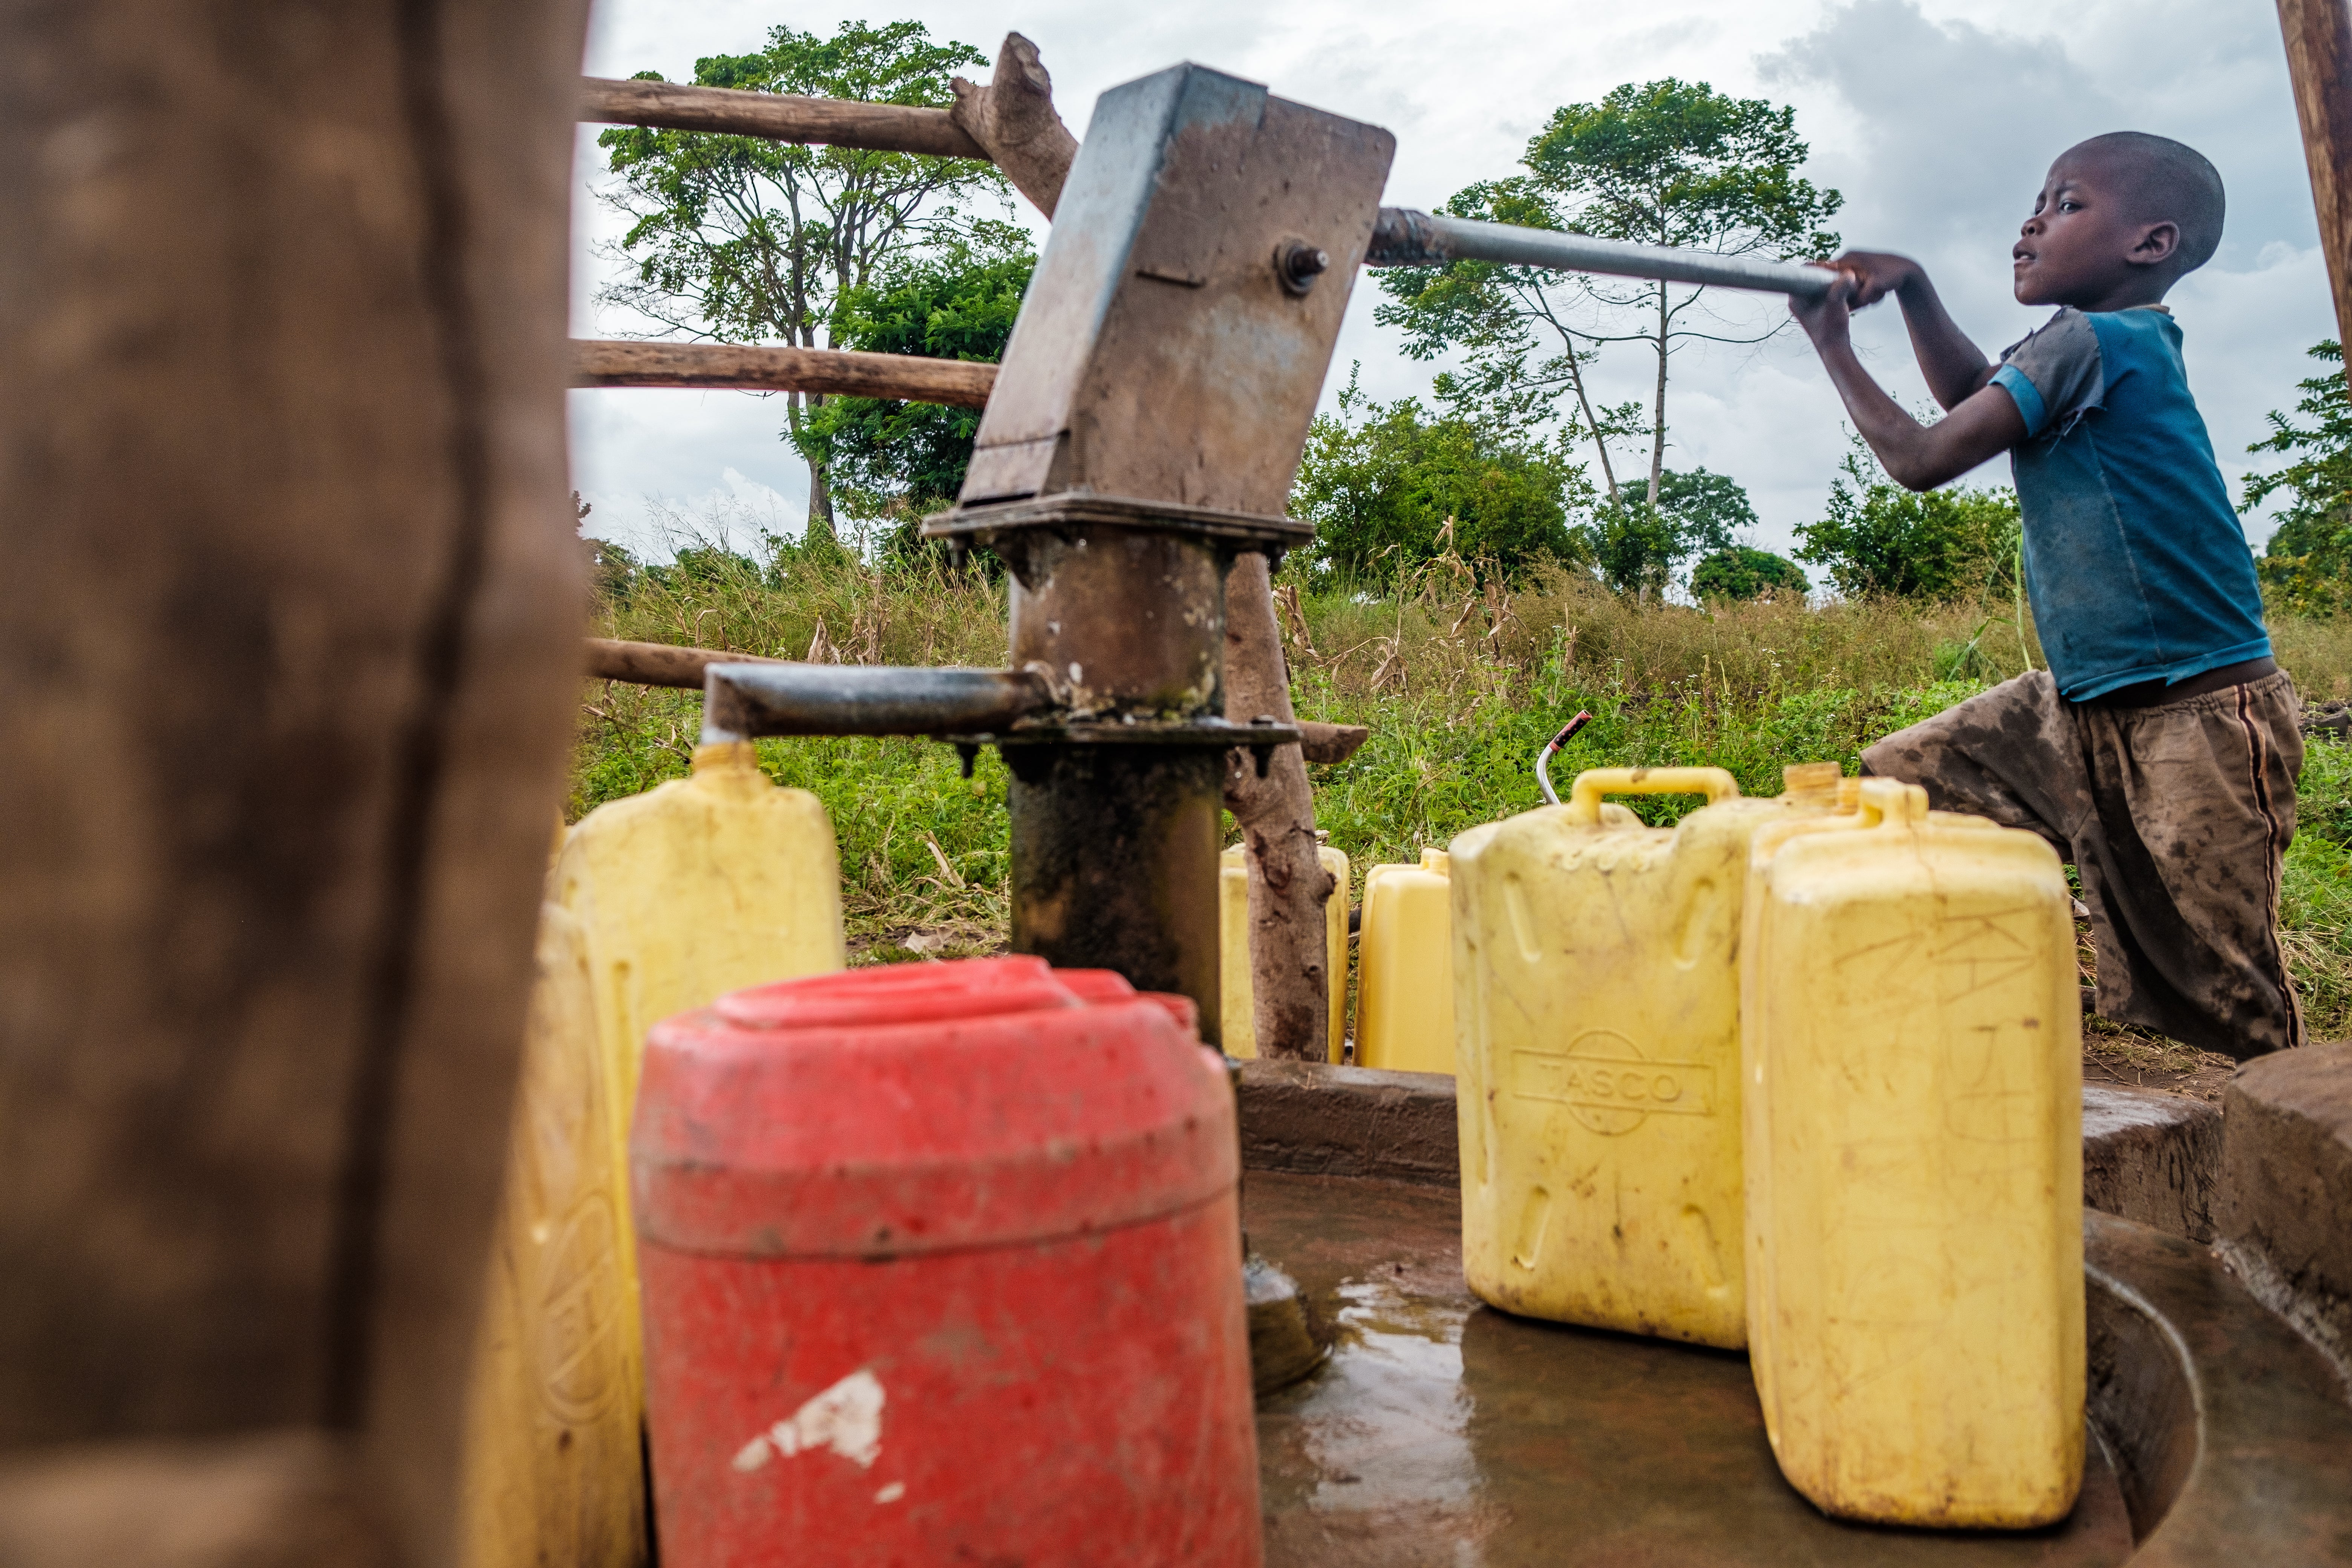
Between 2000 and 2016, those with access to improved sanitation quintupled from 4 percent to 21 percent, those with access to a basic drinking water source nearly doubled, rising from 22 percent to 41 percent, and those using piped water also almost doubled, increasing from 11 percent to 21 percent. Over the same period, open defecation declined from 15 percent to 6 percent., While inequalities in general have declined over time in Uganda (see Inequity section ), we found that inequalities in access to improved sanitation have increased slightly.
Results from our decomposition analysis suggested that access to a piped water source and reductions in open defecation accounted for 4.5 and 2.7 percent of the predicted growth improvements among children under five, respectively. This finding is most likely due to the decline in childhood infections that occurs as WASH indicators improve. Across national and community-level stakeholders, there was consensus that WASH indicators had improved over time, leading to decreased diarrheal disease among children. Some credited the Village Health Teams with increasing community awareness around improved practices regarding sanitation and hygiene.
Although the Uganda Water Action Plan established a framework for policies related to WASH as far back as 1995, the WASH sector has suffered from a shortage of effective policymaking over time. The Pro-Poor Strategy for the Water and Sanitation Sector (2006) aimed to increase water access for poor communities, but this strategy faced significant implementation challenges, as evidenced by the growing disparities in access to WASH. More recently, the Regional Health Integration to Enhance Services in East Central Uganda (2016–2021), was implemented in 2016 and has helped improve household access to WASH in 12 districts of East Central Uganda. As this initiative is expanded and scaled, there is hope that other Ugandan districts will gain similar benefits.
