
Political shifts
Nepal has made significant progress economically and in improving health for its citizens over the past three decades, demonstrating incredible resilience in the face of challenges. The nation transitioned from an absolute monarchy to a constitutional monarchy to a federal democracy, and it had a civil war from 1995 to 2005. Nepal has a well-established history of active civil society engagement in social welfare, health and sanitation, human rights, community development, political advocacy, and more. Civil society organizations have played important roles throughout this government evolution by assisting service delivery, supporting social cohesion, and promoting accountability. In 2015, the Nepali constitution was ratified, guaranteeing the right to health: the government is mandated to provide basic and emergency health services free of cost for all citizens.
Demographic characteristics
Nepal has experienced major demographic and socioeconomic changes over the last three decades, as shown in Table 1 below. The population has aged in the past 20 years, driven by increases in life expectancy and declines in fertility. Life expectancy rose by more than 16 years from 54.4 years in 1990 to 70.8 years in 2019. Fertility dropped from 4.6 births per woman to 2.1 births per woman from 1996 to 2021, based on DHS data. Women are increasingly completing secondary education or higher, from 2.2% of women in 1996 to 17.4% of women in 2022. There is also a gradual shift to living in urban centers; however, approximately 79% of the population remains rural. Kathmandu is the nation’s capital and Nepal’s largest urban area, with 1.5 million inhabitants.
Nepal’s constitution established the country as a secular state, but it defines protection for religion and culture. Approximately 81% of Nepalis are Hindu, 8% are Buddhist, and 5% are Muslim. Nepal has 14 recognized national languages. Nepali, the most widely spoken official language, is spoken by 44.6% of the country, but 13 other official languages are spoken by at least 1% of the population. Nepal is also culturally diverse, with no single group making up more than 17% of the population. Large ethnic groups include Chhettri, Brahmin-Hill, Magar, and Tharu.
Table 1: Demographic characteristics of Nepal, 1990, 2000, and 2020
| 1990 | 2000 | 2020 | |
|---|---|---|---|
Population | 18,905,480 | 23,941,099 | 29,136,808 |
Annual population growth | 2.47% | 1.82% | 1.83% |
Total fertility rate (births per woman) | 5.7 | 4.1 (2001 DHS) | 2.1 (2021 DHS) |
4.6 (1996 DHS) | 2.3 (2016 DHS) | ||
Annual births (thousands) | 3,763 | 3,551 | 2,798 |
Population density (people per square kilometer of land area) | 132 | 167 | 196 |
Percentage of population living in urban areas | 8.9% | 13.4% | 20.6% |
Life expectancy | 54.4 years | 62.3 years | 70.8 years (2019) |
Percentage of rural population with access to electricity | NA | 19 | 94 (2018) |
GDP per capita, PPP (current international dollars) | US$859 | US$1,354 | US$3,693 (2019) |
GNI per capita, PPP (current international dollars) | US$860 | US$1,360 | US$3,740 (2019) |
Source: All data are from World Bank indicators, except the percentage of rural population with access to electricity, which is from the United Nations Development Programme, and birth information from the UN. Fertility rates where noted are from the Nepal DHS.
Abbreviations: GDP, acgross domestic product; GNI, gross national income; NA, not available; PPP, purchasing power parity; UNDP, United Nations Development Programme.
Figure 41: Population pyramid in Nepal, 2000–2020

United Nations, Department of Economic and Social Affairs, Population Division. World Population Prospects: The 2019 Revision. (Medium variant)
Geographic and subnational characteristics
Nepal is landlocked and borders India to the south and China to the north. It is home to eight of the world’s highest peaks, including Mount Everest. The country has three ecological zones: the mountain ecological zone along the northeastern border, the hill ecological zone in the central areas, and the southernmost plains known as the terai ecological zone. Terai, hills, and mountain ecological zones represent respectively 23%, 42%, and 35% of Nepal’s area. Most of the population is divided nearly equally between the southernmost plains of the terai and the central hilly ecological zone, with the mountain ecological zone being more sparsely populated. Physical infrastructure is generally harder to build in the mountain ecological zone; ease of building increases in the lower-altitude hill and terai ecological zones. These ecological zones cut across the former development region boundaries and the current provincial boundaries of the country described below. Nepal lies in a seismic zone; it experienced a massive earthquake in April 2015, which seriously impacted health and other infrastructure. Overall population density is quite low at 203 people per square kilometer on a total land area of 143,350 square kilometer.
Until 2015, Nepal had 75 districts distributed across five development regions: Far-Western, Mid-Western, Western, Central, and Eastern. In September 2015, the development region boundaries were phased out and the country was administratively divided into seven provinces: Sudurpashchim, Karnali, Lumbini, Gandaki, Bagmati, Madhesh, and Koshi. Madhesh is the densest province with 633 people per square kilometer, and Karnali is the least dense province with 60 people per square kilometer. Two districts were also split, creating a total of 77 districts. Kathmandu is in the province of Bagmati, in the former Central development region, and also in the hill ecological zone.
Household infrastructure
Economic progress has translated to improved infrastructure at the household level (see Figure 42 below), though not equally for all provinces, ecological zones, and groups. A vast majority of the population, 96.4% in 2022, had access to electricity, up from 17.9% in 1996. Nepal is also experiencing rapid digital infrastructure modernization, with 95.8% of households having a mobile phone in 2022 compared with 5.5% in 2006.
Motorcycle ownership in 2022 had grown to 27.9% of households nationally, with private car ownership at 5.0%; both figures are higher in urban areas and in the terai and hill ecological zones of Nepal. Alongside better roads, the increased number of motorized vehicles—whether individuals or communities own them—has increased women’s access to services. A key informant doctor working in a rural area commented, for example, that women now often get lifts in tractors and trucks to get to facilities. Other interviews both at the national and district levels brought up the improved quality and quantity of the roads increasing access to services. One rural district hospital manager stated:
"Whenever we talk of women's health, look at the roads."
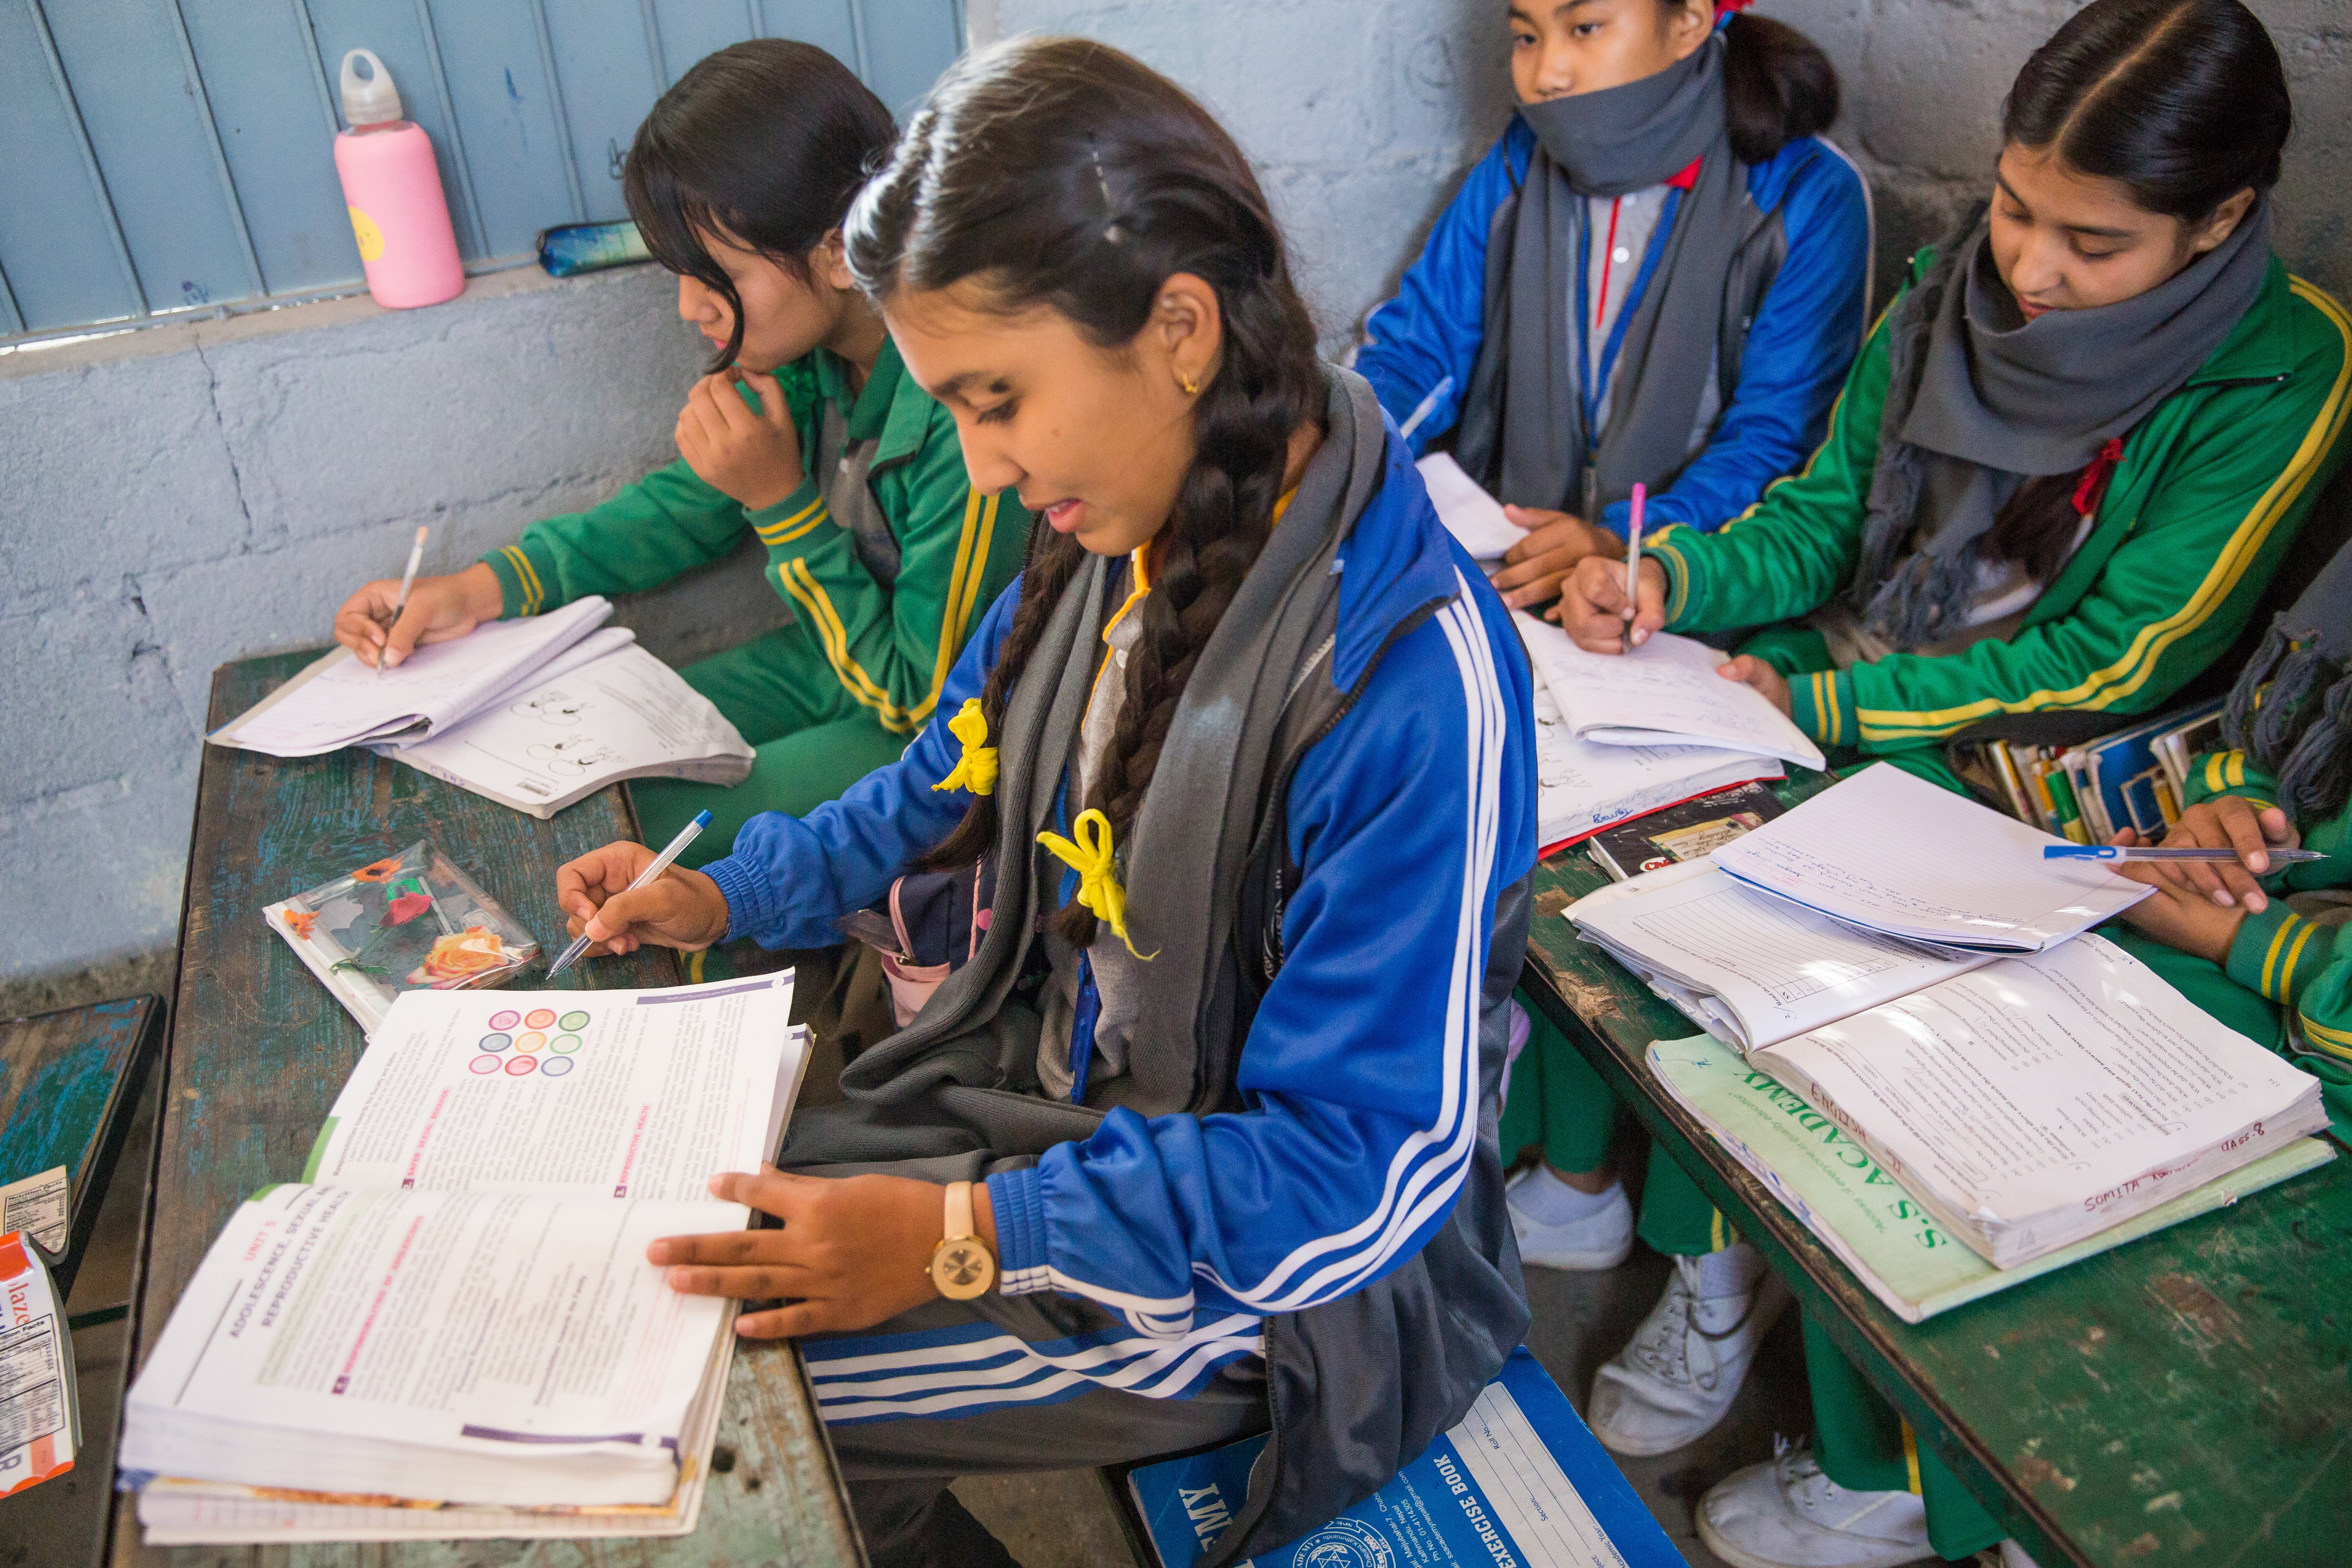
Women’s empowerment
Nepali women are increasingly completing higher levels of education and getting married at a later age. The percentage of women with secondary education increased from 2.2% in 1996 to 17.4% in 2022, and literacy rates increased from 35.3% to 74.4% from 2001 to 2022. Early marriage has also been an area of concern in Nepal, but the percentage of women first married at age 15 decreased 80% between 1996 and 2021 from 14.4% to 2.8% of women. However, women’s employment decreased from 77.3% in 1996 to 59.5% to 2022, which may be related to husbands increasingly working overseas and sending back remittances—discussed in the . See Figure 42 above for more on these indicators.
Other public health challenges
Nepal has not experienced particularly severe malaria or HIV epidemics in comparison with peer countries. In Nepal, the HIV prevalence among adults is 0.1%, below the 1% threshold considered generalized and severe. Malaria incidence has fallen to near-zero levels since 2019. Women’s nutrition is one key area in which Nepal still faces some challenges: approximately 34.0% of all women ages 15 to 49 had anemia as of 2022, and 13.4% of women had low body mass index. Anemia can contribute to and worsen complications at birth, such as post-partum hemorrhage. Tobacco usage among women is also decreasing, with only 13% of women being tobacco users in 2020.
COVID-19 was the number one-ranked cause of death according to 2021 Global Burden of Disease data. Chronic health conditions such as ischemic heart disease, chronic obstructive pulmonary disorder, and stroke are the next largest contributors to mortality. As Nepal continues in the epidemiologic transition, the rise of chronic diseases necessitates health system adaptation to address the shifting needs of the population.
Economic growth, industries, and remittances
Nepal’s gross domestic product (GDP) per capita was US$1,337 in 2022, a large increase from their GDP per capita of US$224 in 2000. Nepal’s GDP growth rate usually ranged from 3% to 6% between 1990 and 2022. In 2015, after the earthquake, the GDP growth rate increased due to a heavy reconstruction expenditure. Nepal’s GDP growth, which is based on consumption, has a substantial proportion led by remittances. One of the major changes witnessed after 1990 was increases in migrant workers’ remittances, which now contribute approximately one-quarter of the GDP. Increased levels of remittance have reduced poverty and increased food and nonfood consumption expenditure, including health expenditure. Studies have shown that remittance-receiving households spend more on health compared with nonreceiving households.,
As a nation, Nepal’s GDP is driven mainly by the service sector, which made up approximately 62% of the GDP in 2021. The agricultural sector and industrial sector respectively made up approximately 24% and 14% of GDP in 2021. However, approximately 69% of Nepal’s population is employed in agriculture. Industries such as mining, manufacturing, energy production, and construction made up 12% of employment, and services including government activities, tourism, communications, transportation, finance, and others made up 19% of employment in Nepal.
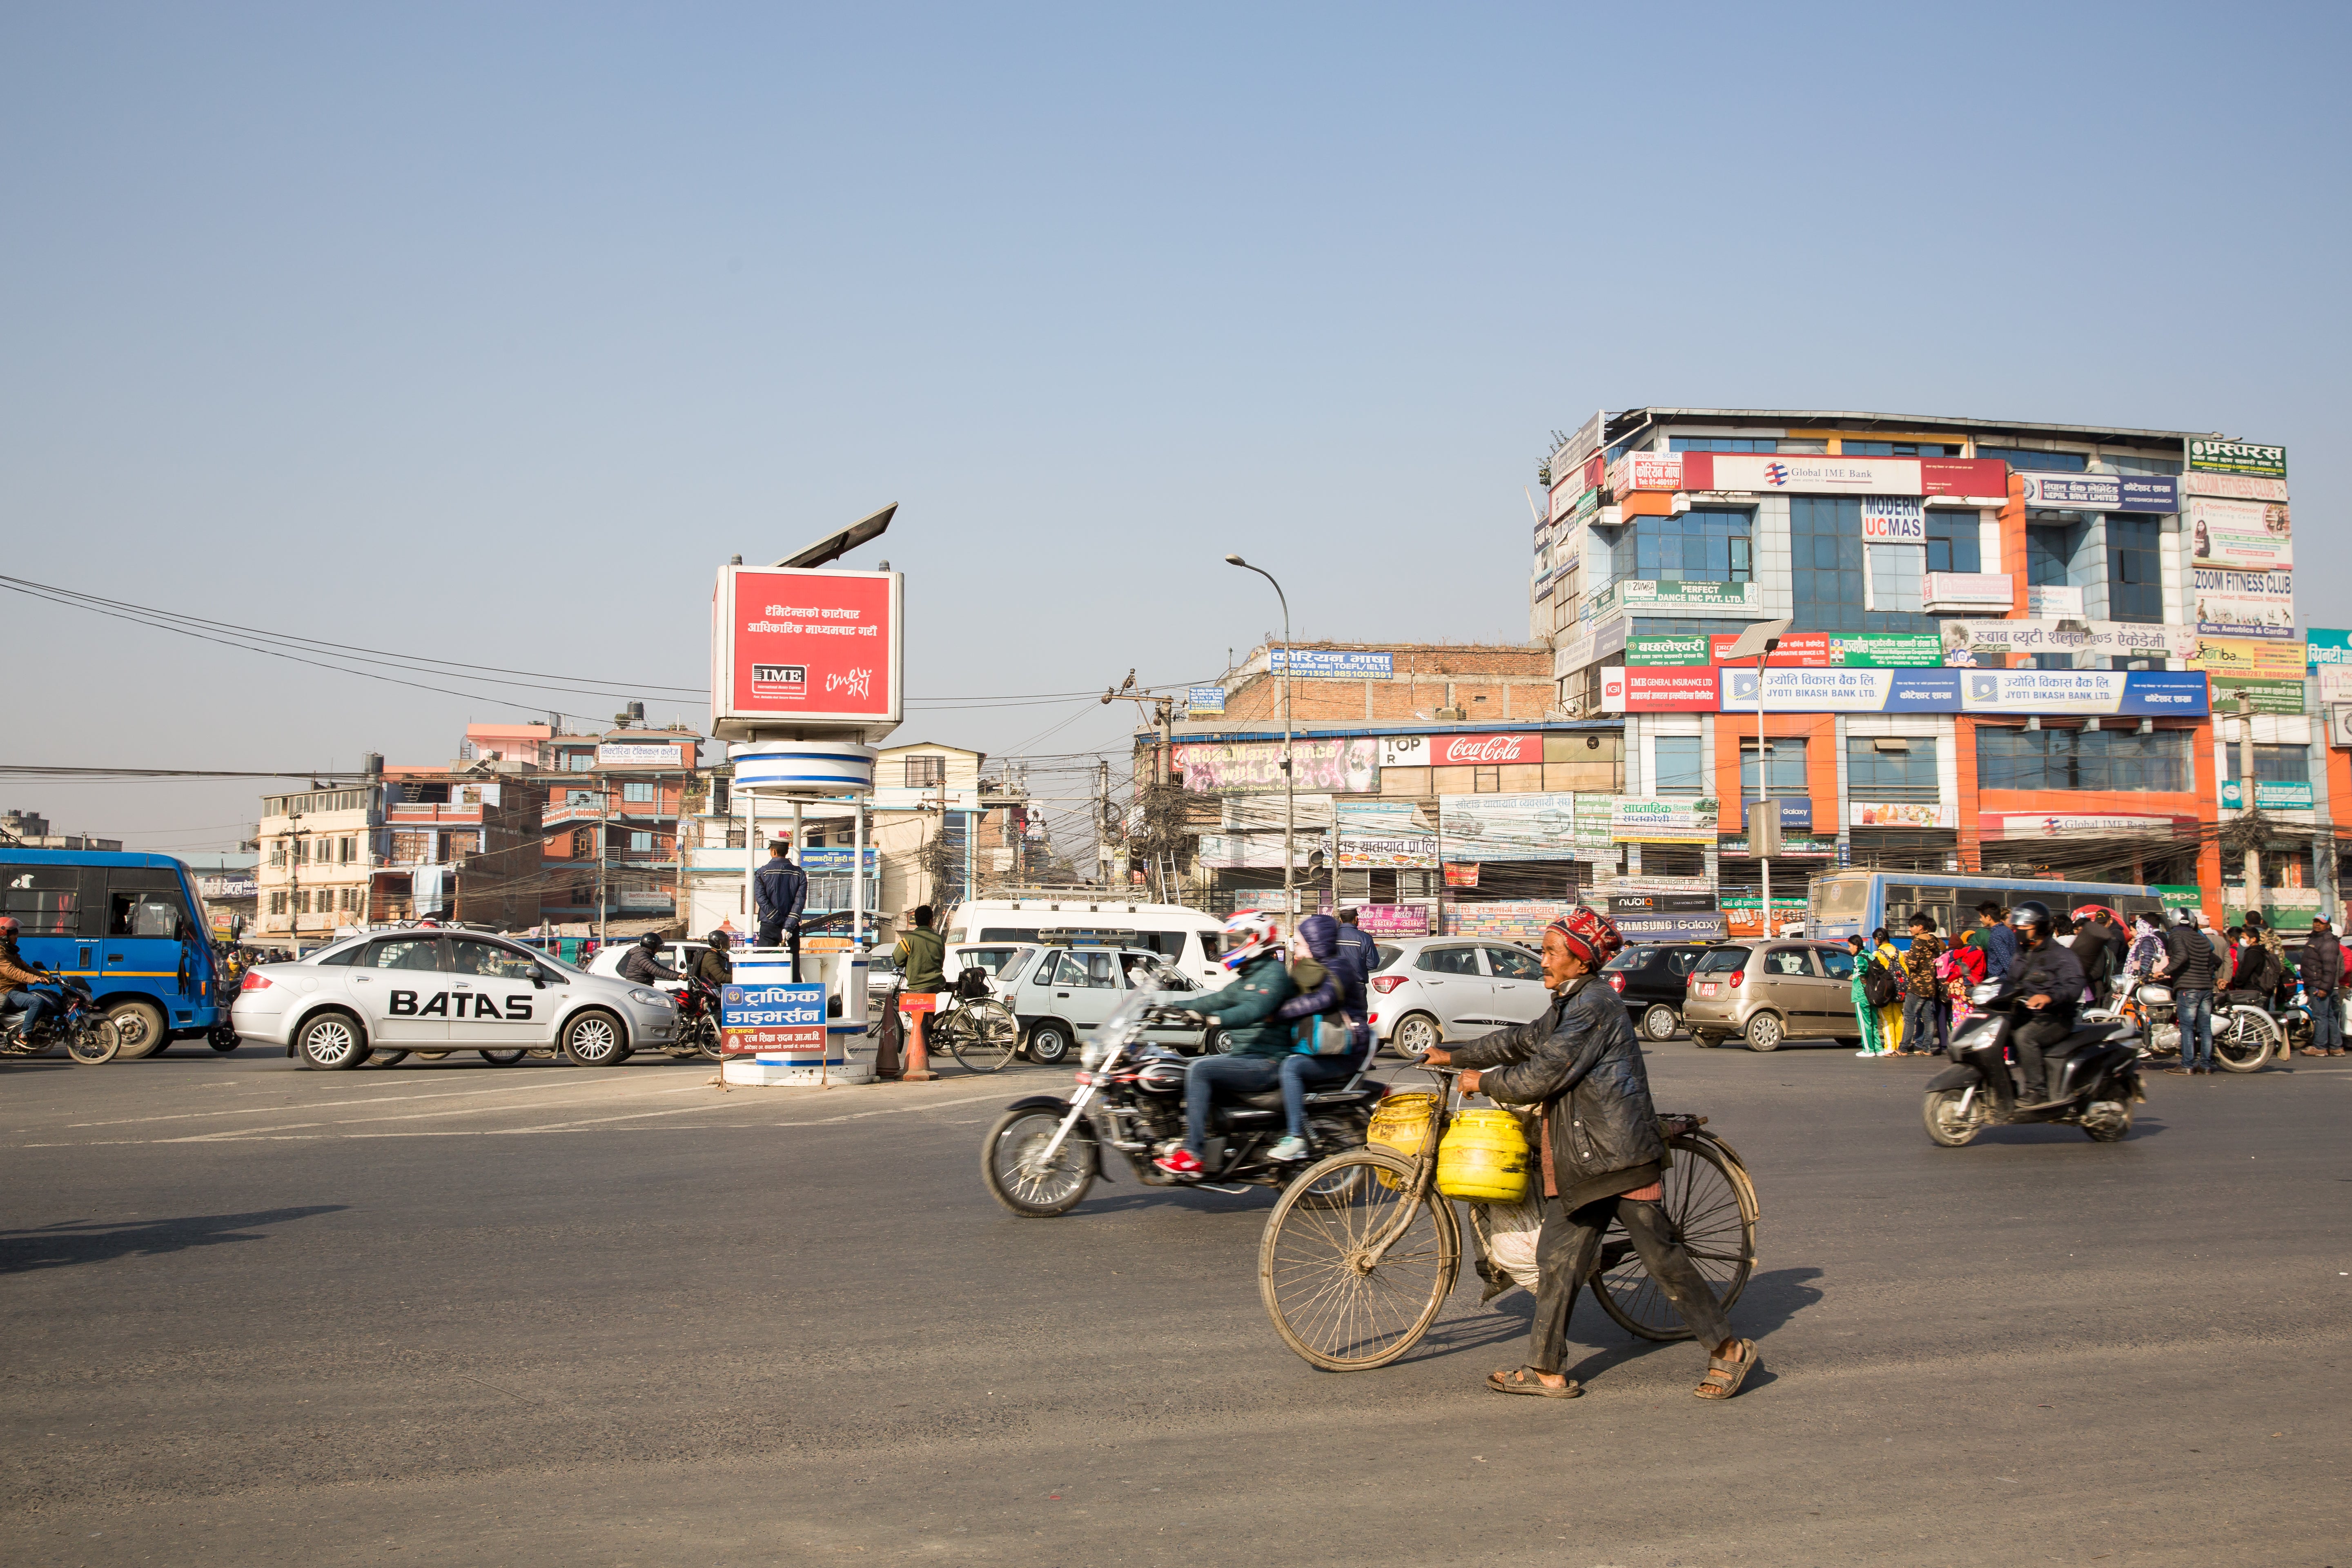
Figure 43: Development assistance for health in Nepal, 2000–2019

Institute for Health Metrics and Evaluation (IHME). Financing Global Health Visualization. Seattle, WA: IHME, University of Washington, 2021. Available from http://vizhub.healthdata.org/fgh/