Key Points
Continued nutrition challenges:
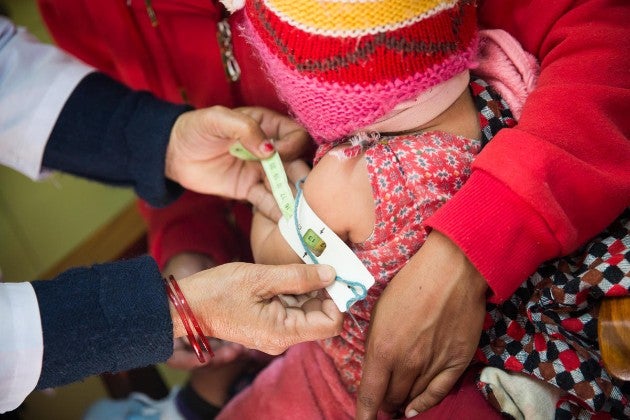
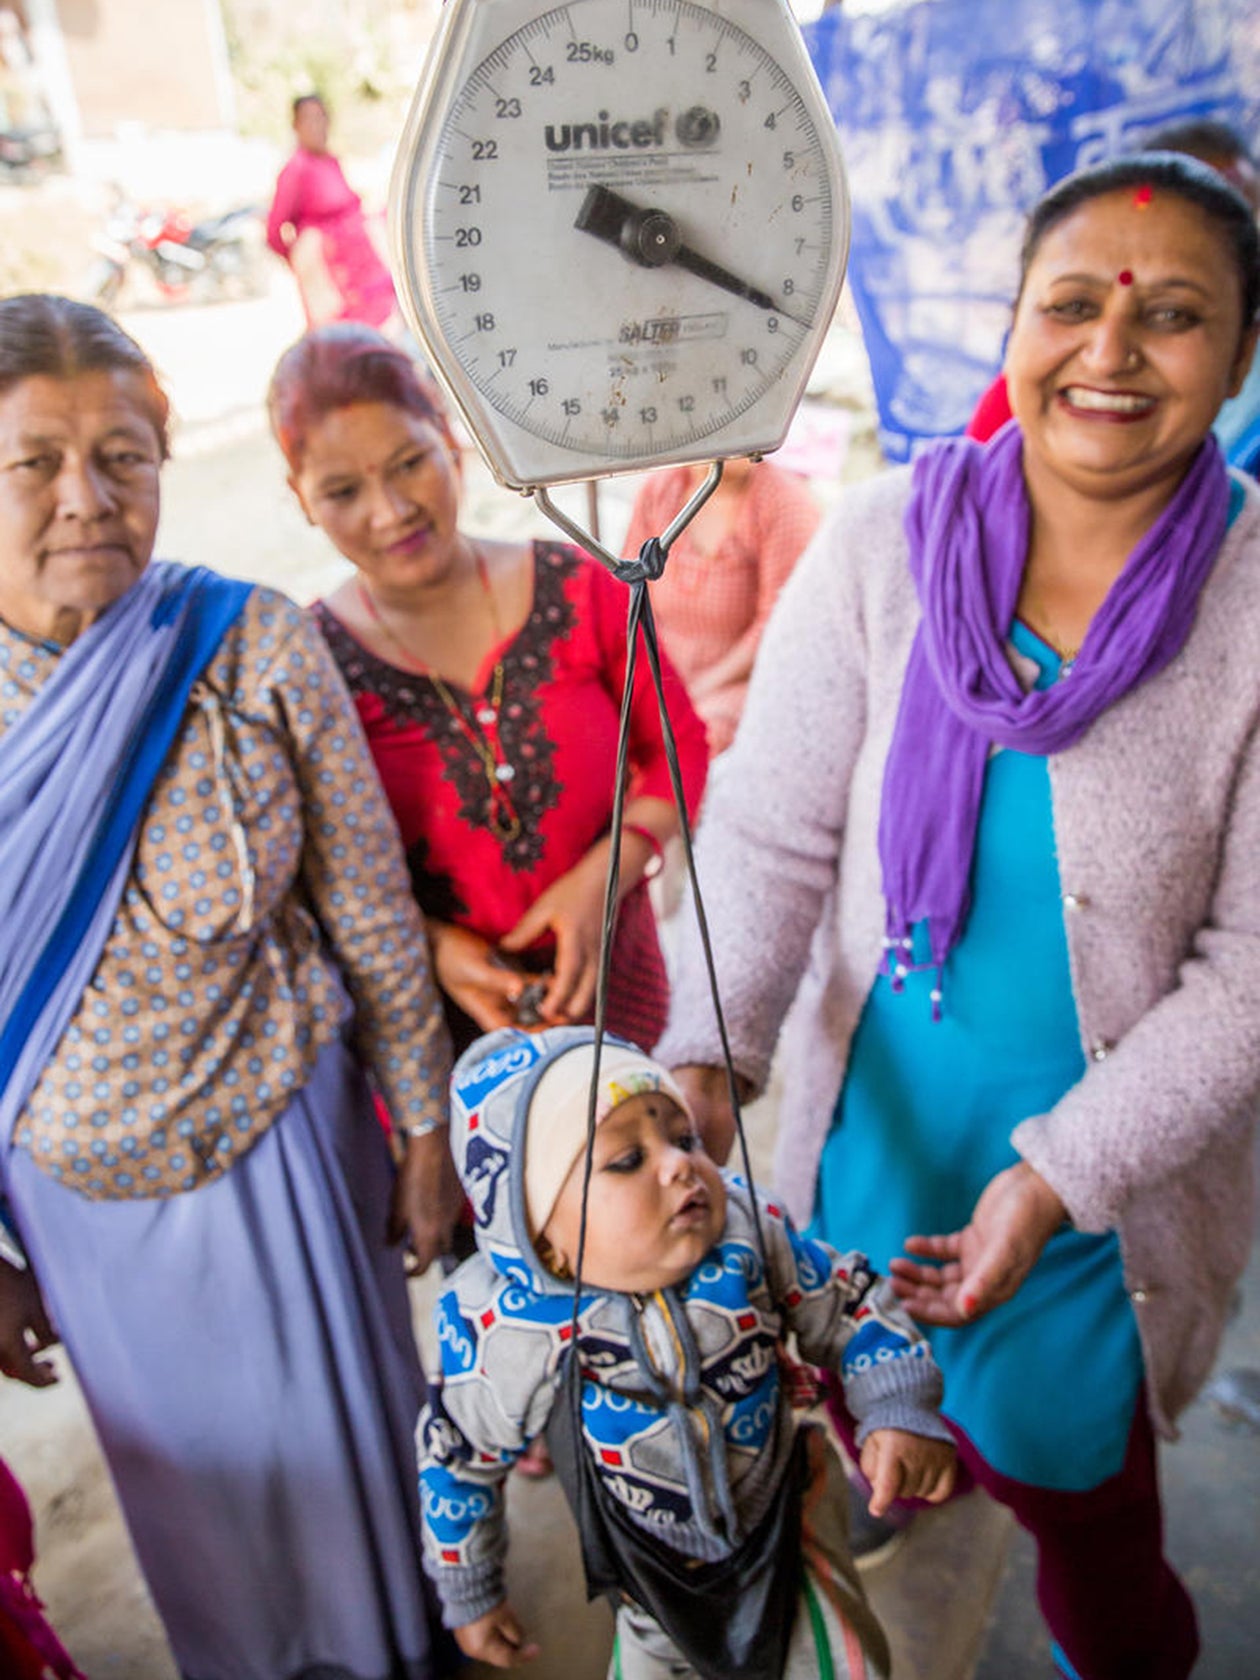
Despite rapid progress, stunting prevalence remains high, at 36 percent. Other remaining challenges include high rates of anemia (40 percent among pregnant women) and wasting (10 percent).
Inequality:
While stunting has declined across Nepal, it has not done so evenly - lower wealth quintiles, disadvantaged groups, and remote regions have made slower progress, leading to widening inequalities.
Out-of-pocket payments:
Over 50 percent of health spending in Nepal is out of pocket. These payments have the potential to exacerbate inequalities by lowering health care access for the poor.
Educational quality:
Although enrollment and literacy rates have increased, other metrics of educational achievement in Nepal remain poor. Students in public schools, rural areas, and in homes where minority languages are spoken face disadvantages.
Health workforce:
While the number of physicians, nurses, and midwives has increased dramatically over the last decade, a shortage, especially in rural areas, remains. Moreover, the first cadre of FCHVs is reaching retirement age, and the government will need to attract and train qualified replacements.
Agricultural productivity:
Agricultural productivity in Nepal has been stymied by labor shortage (as many workers migrate abroad for work) and yields that have improved only minimally relative to those of neighboring countries.
Sustainability:
Donors and NGOs have played an important role in Nepal’s stunting reduction, but their support has also led to some dependency on outside funding and technical expertise.
Continued nutrition challenges
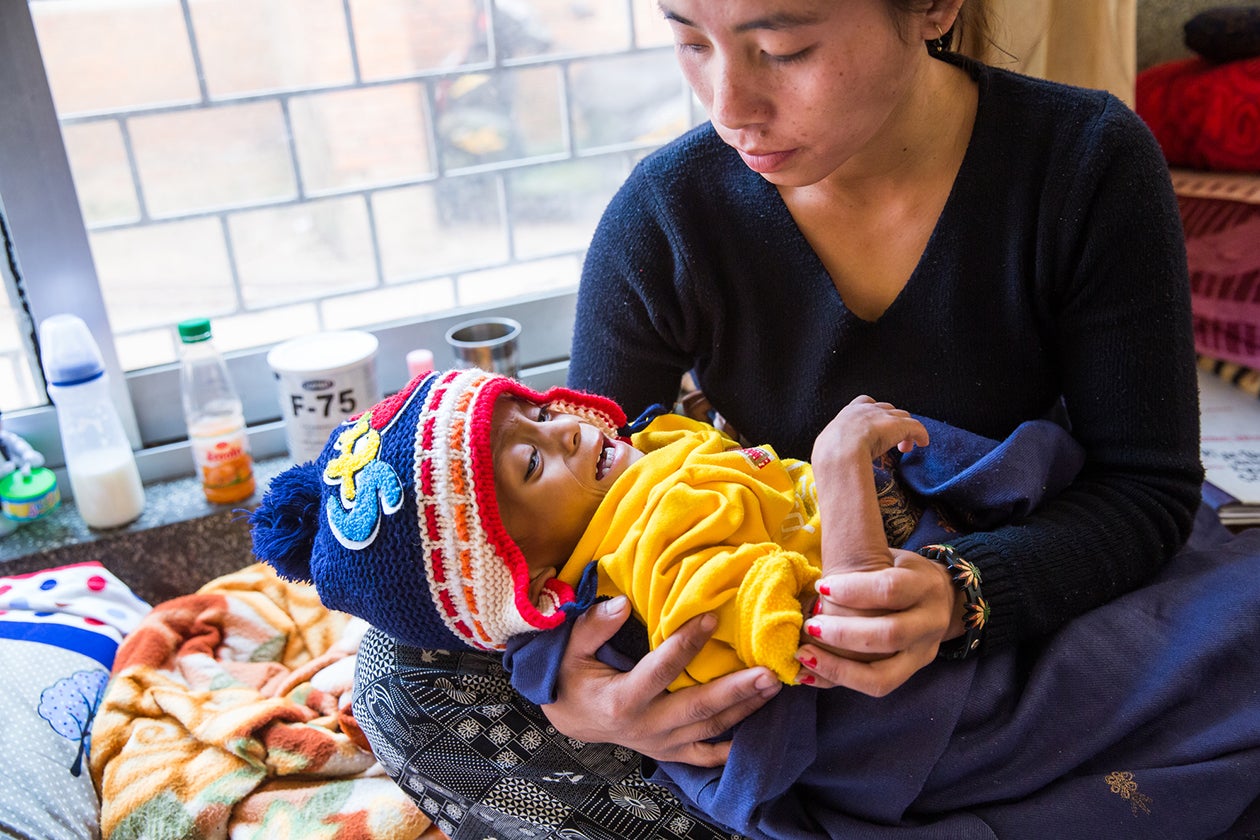
At 36 percent prevalence, stunting is still a massive challenge in Nepal. Moreover, some micronutrient deficiencies are also rampant, with 40 percent of pregnant women suffering from anemia. Wasting is also a significant challenge in Nepal, and, unlike stunting, the rate has not changed much in the past 20 years. In 1996, 13 percent of children were wasted. In 2016, that figure was ten percent. The percentage of children who are both stunted and wasted was very high - 6.6 percent as recently as 2006, and although that number has declined along with the stunting rate, 3.3 percent of children were both stunted and wasted in 2016. This is also an issue of equity, as almost half of the households in the lowest wealth quintile are food insecure, and those in remote mountain areas depend on subsistence agriculture for daily consumption.
One promising bellwether is the number of multi-sectoral efforts to improve nutrition that have been launched as nutrition has become a priority for the development sector in the past several years. These projects, plans, and strategies are based on the latest insights in the field, especially the idea that health, nutrition, agriculture, and education need to be integrated to improve stunting. In a way, Nepal had been acting on these insights for decades, since it had extended and improved many of these systems simultaneously. In the decades to come, we will find out if a more purposeful integrated nutrition strategy continues or even accelerates progress.
| MULTI-SECTORAL EFFORT | TIME PERIOD | DESCRIPTION |
|---|---|---|
Integrated Nutrition Project (SUAAHARA) | 2011 - 2016 | Part of USAID strategy to improve health of women/children under 2 years through a multisectoral approach (health, nutrition, agriculture, food security); reached 41 districts |
Community Action for Nutrition Project (Golden 1000 Days Project) | 2012 - 2015 | World Bank-supported program aiming to adopt life cycle approach to reducing undernutrition in women of reproductive age and children under two |
Multi-Sector Nutrition Plan (MSNP I) | 2012 - 2017 | Five-year plan to improve maternal and child nutrition through development policies/plans and multi-sectoral coordination at national and sub-national levels, promotion of nutrition-specific and –sensitive services, and improved capacity of central/local governments on nutrition |
Health Sector Strategy for Addressing Maternal Undernutrition | 2013 - 2017 | Nationwide plan to accelerate and sustain reduction in chronic malnutrition among adolescent girls, pregnant and lactating women, with focus on micronutrient deficiencies |
Strategy for Infant, Young Child Feeding | 2014 - present | Developed to provide a robust framework for improving feeding and care practices through improving optimal breastfeeding, improving age appropriate optimal complementary feeding, ensuring enforcement of national legislation related to infant and young child feeding, and improving consumption of essential micronutrients |
Inequality
Though the stunting burden in Nepal has decreased, inequalities have not. We can demonstrate the rise in inequality with several quantitative analyses.
First, a regional analysis. Nepal is divided into seven provinces (it was five until 2015, but we have been able to retrofit data to the new subdivisions going back to 2001). Six of the provinces had relatively similar stunting rates to each other over the study period, but Province 6, the most mountainous and underdeveloped, has always been an outlier. In 2001, it had the highest stunting rates in the country, and since then it has had the lowest annual rate of change in stunting, which means that the inequality that already existed has only gotten worse. In the other six provinces, the current stunting rate ranges from 27 to 38 percent. In Province 6, it is 55 percent.
Stunting estimates for children under five years old

Second, we conducted a number of equity analyses to quantify the relationship between stunting and wealth, maternal education, caste, and rural or urban residence.
In 1996, children from the richest 20 percent of Nepalese families were significantly less likely to be stunted than other children, but the rates for all other children were similar, whether they were in the second or fifth wealth quintile. Over time, although stunting has declined in all quintiles, the gap between the richest and everyone else has stayed wide, and a new gap has developed between the poorest and the middle three quintiles. The gaps are similarly wide in the cases of maternal education and caste, although the caste system in Nepal is so complex that it is difficult to capture precise data.
There is also a gap between rural and urban dwellers, though this gap closed in 2016. While a smaller gap seems like a good thing, a closer look shows that the reason for the convergence is an increase in the stunting rate in urban areas from 27 to 32 percent, reflecting the growth of slums and a change in the way Nepal classified rural and urban areas, which led to more areas with relatively high rates of stunting being counted as urban. Children from the poorest families in urban areas currently have the highest stunting rates in Nepal, at above 50 percent.
A third set of analyses that helps us think about equity are HAZ kernel density plots. These graphs represent the full distribution of HAZ scores in a population in any given year. Ideally, over time, the curve moves to the right and gets taller and narrower. The move to the right means that the average HAZ score increased. The pinching of the curve means that more children clustered around the new, healthier mean. In Nepal’s kernel density plots for 0-6 month old and 6-23 month old, the curve moves to the right but does not get taller and narrower. In fact, the curve for 2016 is shorter and wider than the curve for 2001. This suggests that while the overall situation is improving - that is, the mean HAZ is higher - inequality is a growing concern as more children are distributed further away from the new, healthier mean.
HAZ Kernel Density Curves (under-five years)

ICF, 2018. The DHS Program STATcompiler, (various) [data set]. Funded by USAID. Rockville, Maryland; 2017. Accessed 2018
Understanding the meaning of increasing inequality in Nepal may require a unique interpretation, given the epidemiology of stunting in the country. In the mid-1990s, the stunting burden in Nepal was almost universal - the majority of children were stunted, making them, in some sense, equal. But what may have looked like equality was actually the pervasiveness of malnutrition.
Now, as the rate comes down, it is clear that it is coming down faster for some groups than others. Many countries with stunting rates around 30 percent (similar to Nepal’s rate now), including Peru and Kyrgyzstan, have driven stunting down into the teens by focusing specifically on marginalized groups. As Nepal makes investments and policies to build on its progress so far, it should follow these examples and concentrate on reaching the most disadvantaged children and families.
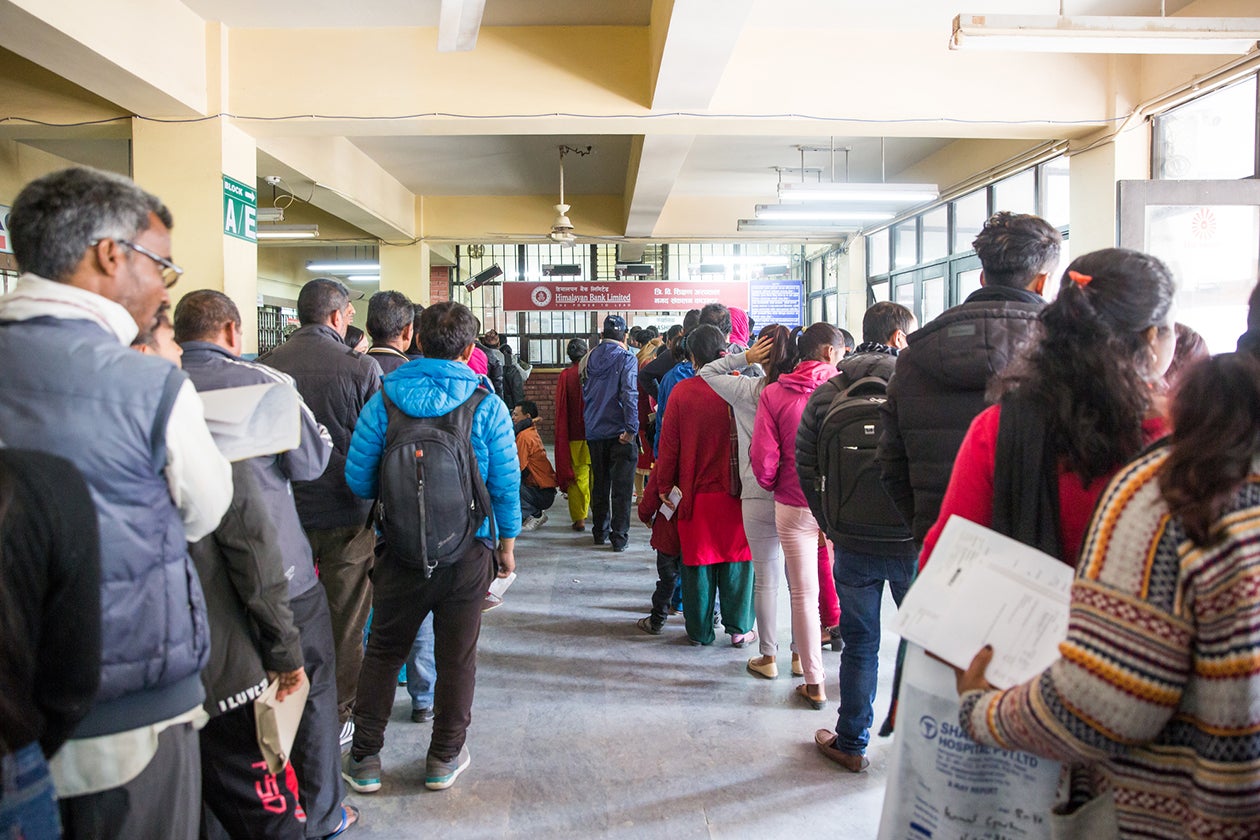
Out-of-pocket payments
Between 2000 and 2016, health spending as a percentage of GDP increased by more than half - and GDP almost quadrupled. Donor contributions also increased.
Overall, health expenditure per capita more than doubled, from US$64 (2017 PPP-adjusted US dollars) in 2000 to $160 in 2015, but it is important to note that less than a quarter of that amount is spent by the government. Almost 15 percent is spent by donors. Most of the rest is spent out of pocket, mostly on private providers, although some public providers still illegally demand payment, too. In 2017, Nepal passed the National Health Insurance Act to address the problem of out-of-pocket payments; it is too soon to tell whether it is working.
Although Nepal’s investments in health have been based on the principles of access and equity, the growth of the private sector suggests two things: First, the public system has yet to solve its access problem, with 45 percent of people in the poorest wealth quintile using private providers. Second, the quality of the public facilities is not high enough, which encourages 60 percent of those in the richest wealth quintile to seek care in the private sector, even though the quality of private-sector care is also uneven. The burgeoning private sector means more people are receiving care, but it may be a barrier to equity, if it further impoverishes the poorest and provides the richest with better care.
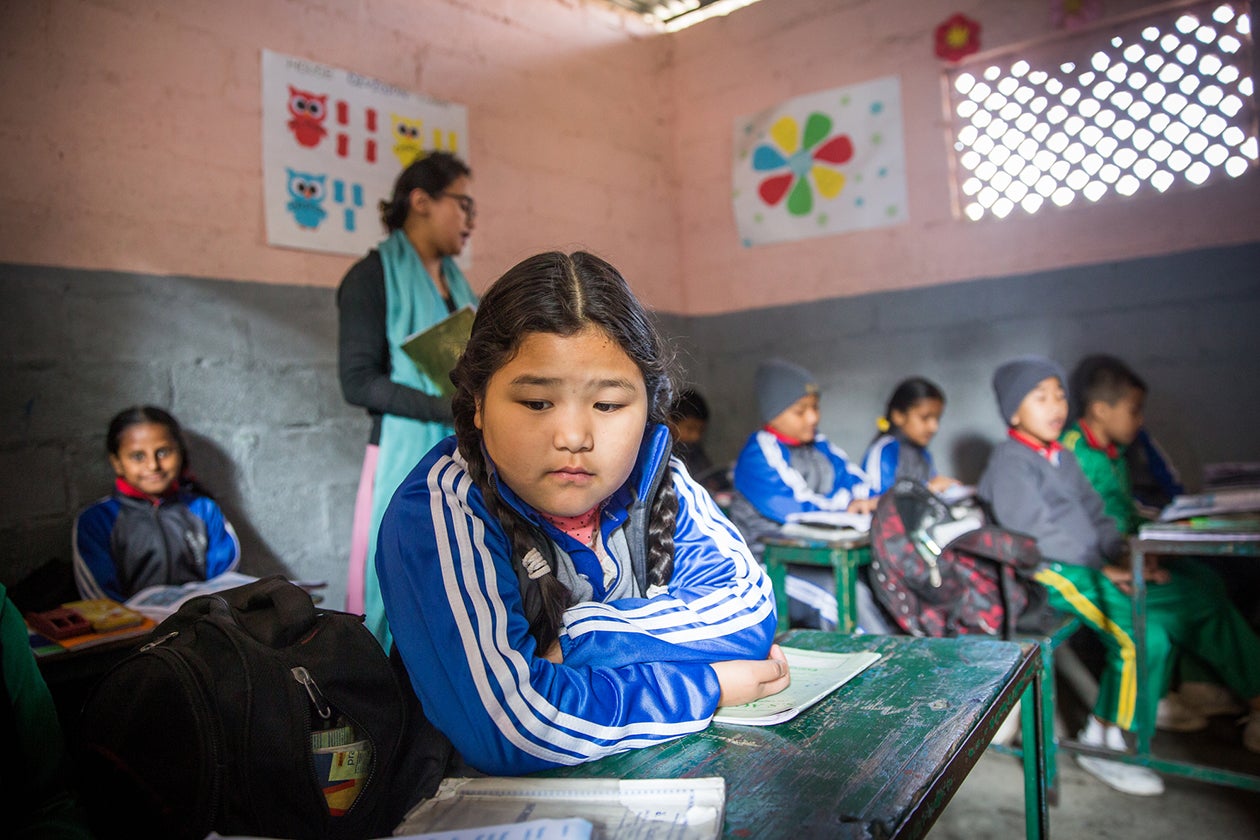
Educational quality
Despite significant improvements in school enrollment and literacy, educational achievement remains low in Nepal. Large achievement gaps separate students in public and private schools, in rural and urban areas, and in homes where minority languages are spoken and homes where Nepali and English are spoken. Moreover, graduation rates are relatively low, with only 25 percent of upper secondary school students completing their education in 2016. Most of those who dropped out were impoverished or lived far away from school.
These educational trends in Nepal mirror global trends in developing countries, wherein educational access and enrollment have improved first, and completion and learning have lagged.
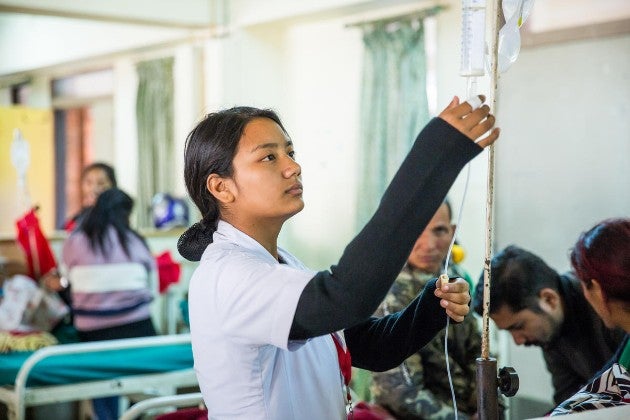
Health workforce
With support from a wide range of donors, the government spent the 1990s and 2000s investing in the growth in health facilities and human resources for health. Although data from the 1990s is sparse, we know that the number of doctors and nurses per 1,000 people increased from 0.7 in 2004 to 2.6 in 2014, bypassing the WHO’s guideline of 2.3 per 1,000 along the way.
However, that does not mean that Nepal’s health access challenges are solved.
Only 19 percent of health training courses in Nepal are offered by the government. The remainder are offered by for-profit institutions clustered around Kathmandu that attract relatively well-off students who intend to stay in the city.
Meanwhile, there is still a serious shortage of staff in rural health facilities. The government has tried a number of solutions, including increased pay for work in rural areas and short-term transfer programs that encourage trained health workers to spend some time in underserved regions. Nevertheless, there are many reasons why health workers choose not to work in remote places. They are not always welcomed by the local community, they have to make do with worse health care and education for their families, and despite the incentive pay their overall compensation can go down, because they do not have the opportunity to work in the private sector on the side.
For its part, the FCHV program has worked because FCHVs receive certain benefits such as free health care, a small retirement stipend, respect and stature within the community, and a sense of accomplishment. However, as many older FCHVs reach retirement age and women gain more options in society, the government needs to plan to attract and train qualified replacements.
Nepal will have to continue to experiment with schemes to encourage the appropriate staffing of the public health system throughout the country.
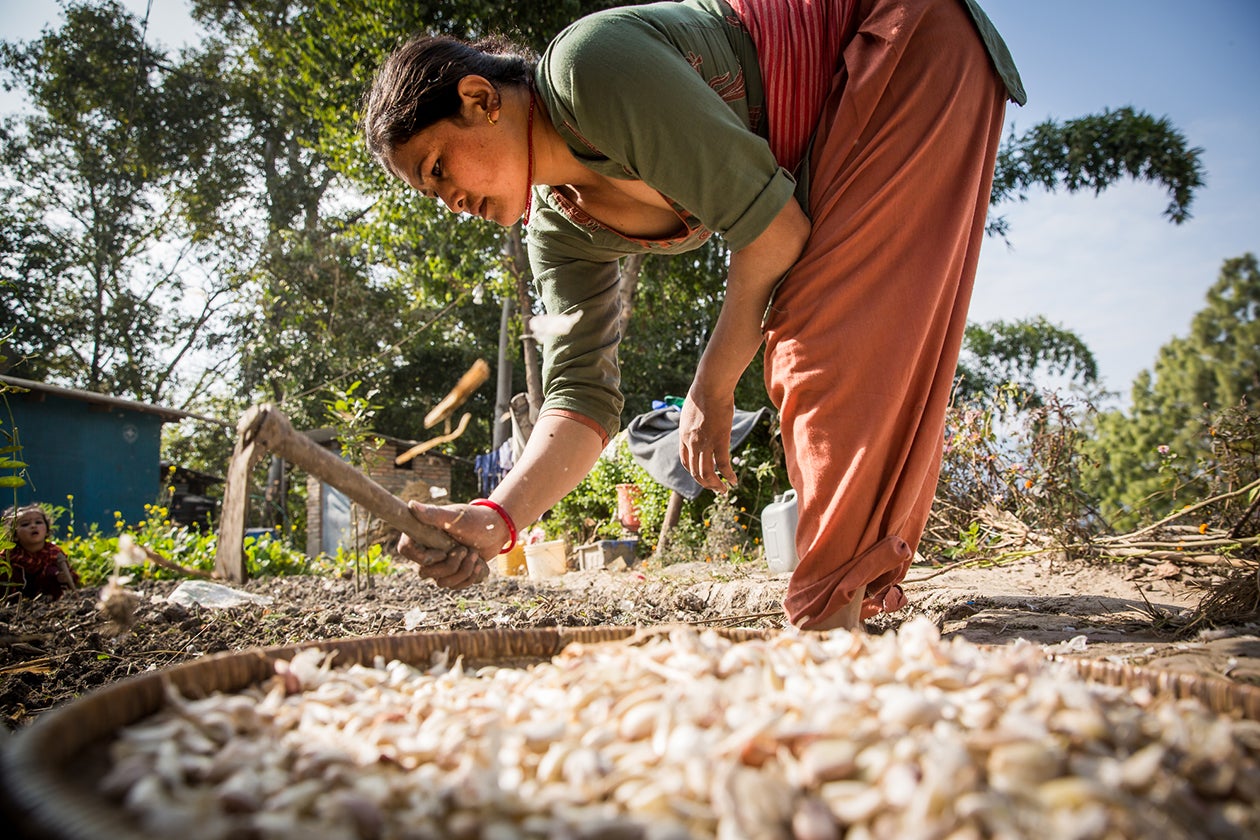
Agricultural productivity
Although Nepal’s stunting story is one of multi-sectoral success, the agriculture sector has not driven improvements as much as it could have. The majority of people work in agriculture, two thirds of them as subsistence farmers; however, as many men migrate for work, there is a labor shortage and some land is lying fallow. Productivity is low. Rice yields, for example, have improved by just 13 percent from 1990 to 2005, much less than in neighboring India (20 percent), Pakistan (37 percent), and Bangladesh (47 percent). Moreover, Nepalese farmers produce very little animal protein. This lack of productivity is an obstacle to poverty reduction, food security, health, and nutrition.
Sustainability
Total donor spending in Nepal increased from $420 million in 2000 to $1.07 billion in 2015. Donors fund almost 15 percent of health spending in the country.
In short, Nepal depends on donors for funding and technical assistance, and if that support were to disappear, Nepal would be hard-pressed to continue much of its aggressive development programming. Gradually, however, as Nepal’s GDP continues to grow, the government will be able to shoulder more of the financial burden. And now that the country has ratified a constitution and politics are stabilizing, the government may be equipped to do more of the work of designing and implementing its development agenda.