Key Points
Starting with Female Community Health Volunteers (FCHVs), Nepal created a health care system capable of reaching its remote population. Investment in basic and primary health care, through health worker training, maternal health programs like the Safe Motherhood Program and Aama, and Community-Based Integrated Management of Childhood Illness, paid off in the form of earlier breastfeeding, reduced sickness, improved treatment, and better outcomes for children and women.
Through programs like the Basic Primary Education Program and Education for All, Nepal reformed and decentralized its education system, kept children in school for longer, and increased enrollment, particularly for girls. Among other benefits, improved education raised incomes, lowered fertility, and improved women’s health and status.
Demand-oriented sanitation programs - Community-Led Total Sanitation, followed by School-Led Total Sanitation - changed behavior in a way that previous supply-oriented programs (e.g., constructing latrines) did not. By stigmatizing open defecation at the community level, these programs enabled improvement in the sanitation environment nationwide.
Significantly reduced poverty, resulting primarily from a surge in overseas labor migration and remittances, enabled households to become more food secure.
Health Care
Female Community Health Volunteers
Female Community Health Volunteers (FCHV)
National cadre of local volunteers who provide basic health education and services
TIMELINE: | 1988 to present |
COVERAGE: | universal coverage with ~50,000 FCHVs |
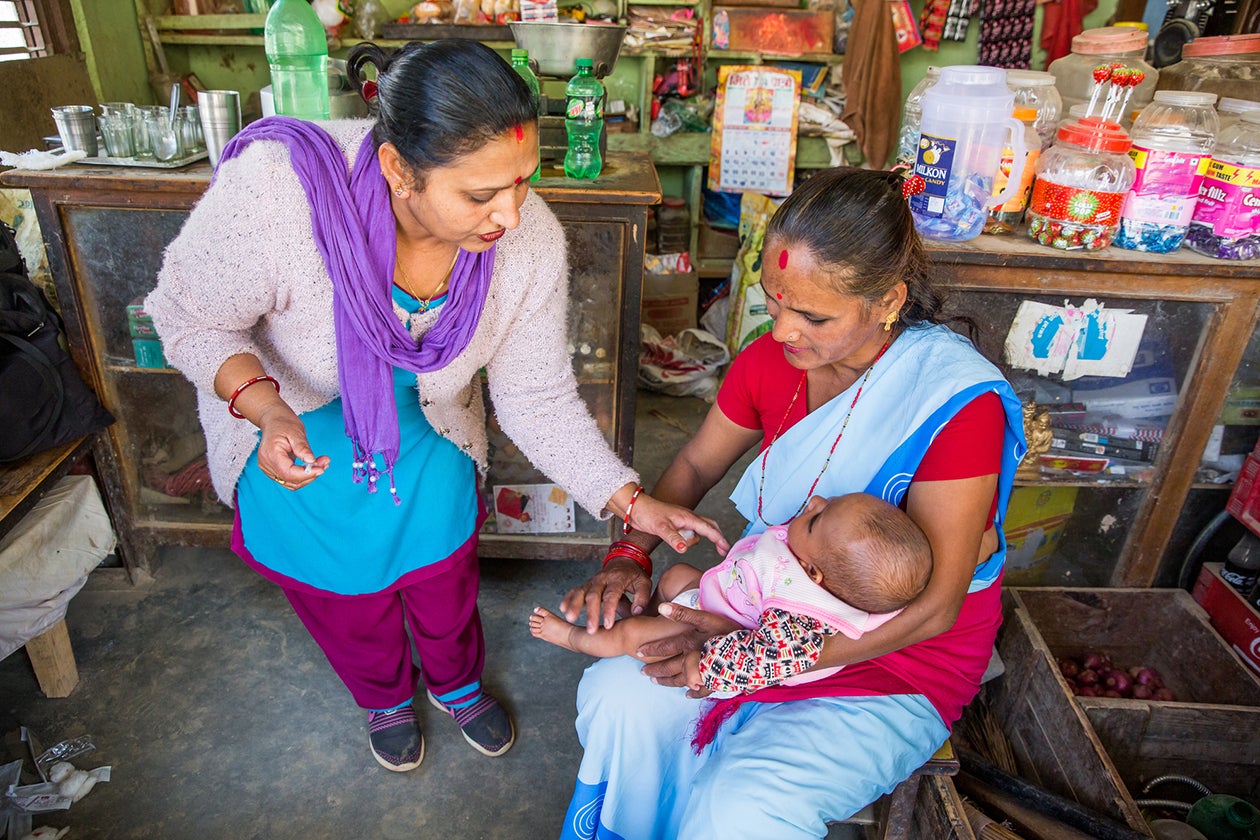
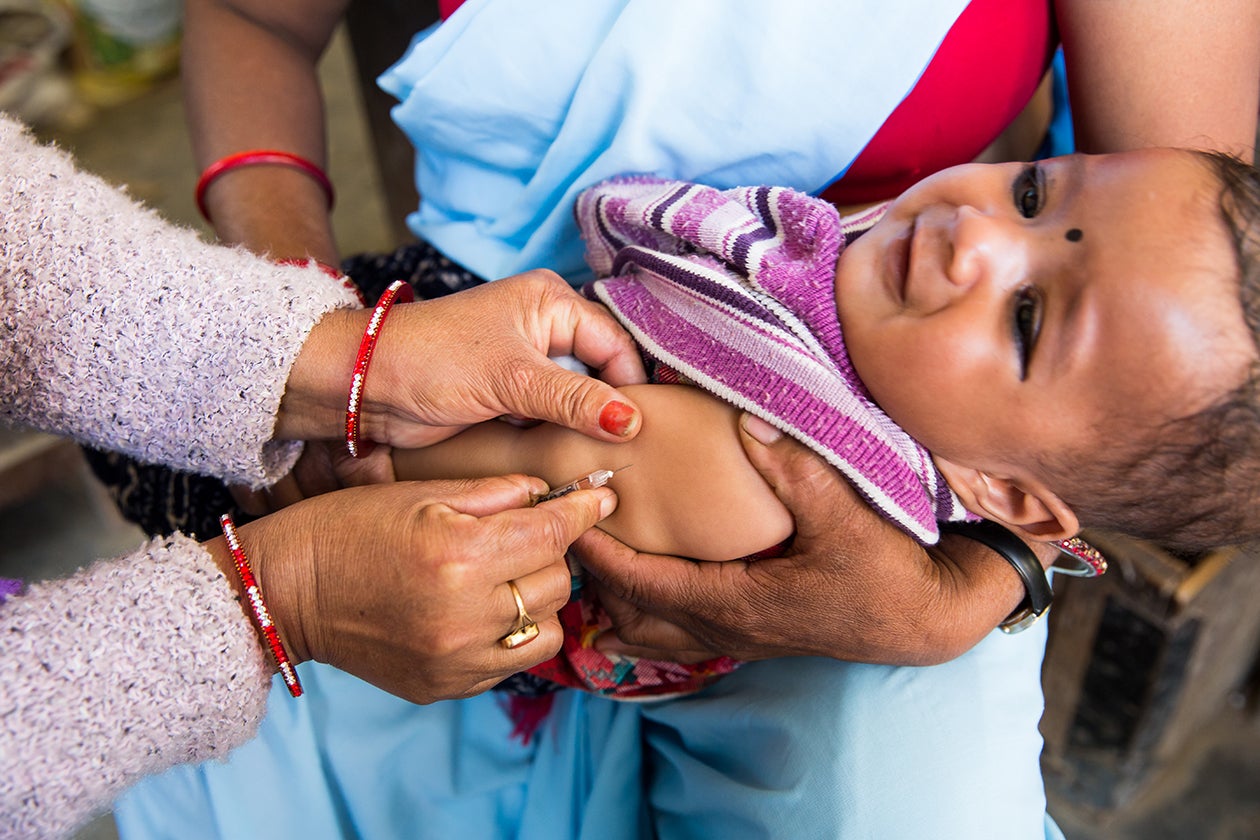
In 1988, as part of the push for decentralization in response to the lack of health care in remote communities, the government of Nepal launched the Female Community Health Volunteer (FCHV) program to extend the reach of the health system into every community. To be a candidate to be selected as an FCHV, women must be between the ages of 25 and 45, they must be married and have children, and they must be from the community they serve. Literacy is strongly preferred. Chosen by local mothers’ groups and trained and supervised by health workers at nearby facilities, FCHVs provide health and nutrition information and basic services. By 1992, the FCHV program had been rolled out nationally, with approximately 20,000 volunteers. In 2017, more than 50,000 FCHVs covered the entire country.
At first, the FCHVs concentrated mainly on promoting family planning, an area in which they have helped drive considerable progress. In 1996, 27 percent of women were using contraception. By 2016, that figure had increased by half, to 41 percent. This development has contributed to the steep drop in fertility, from 4.6 births per woman in 1996 to 2.3 births per woman in 2016 .
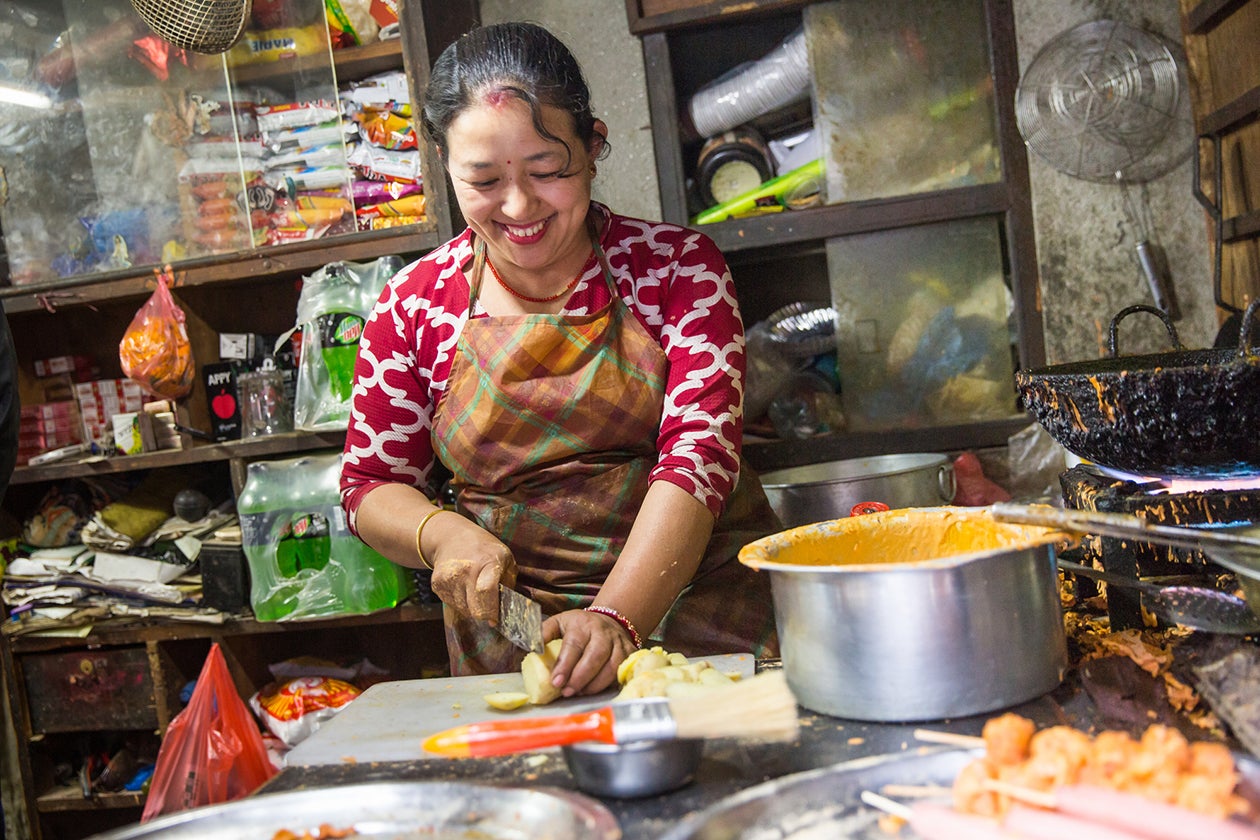
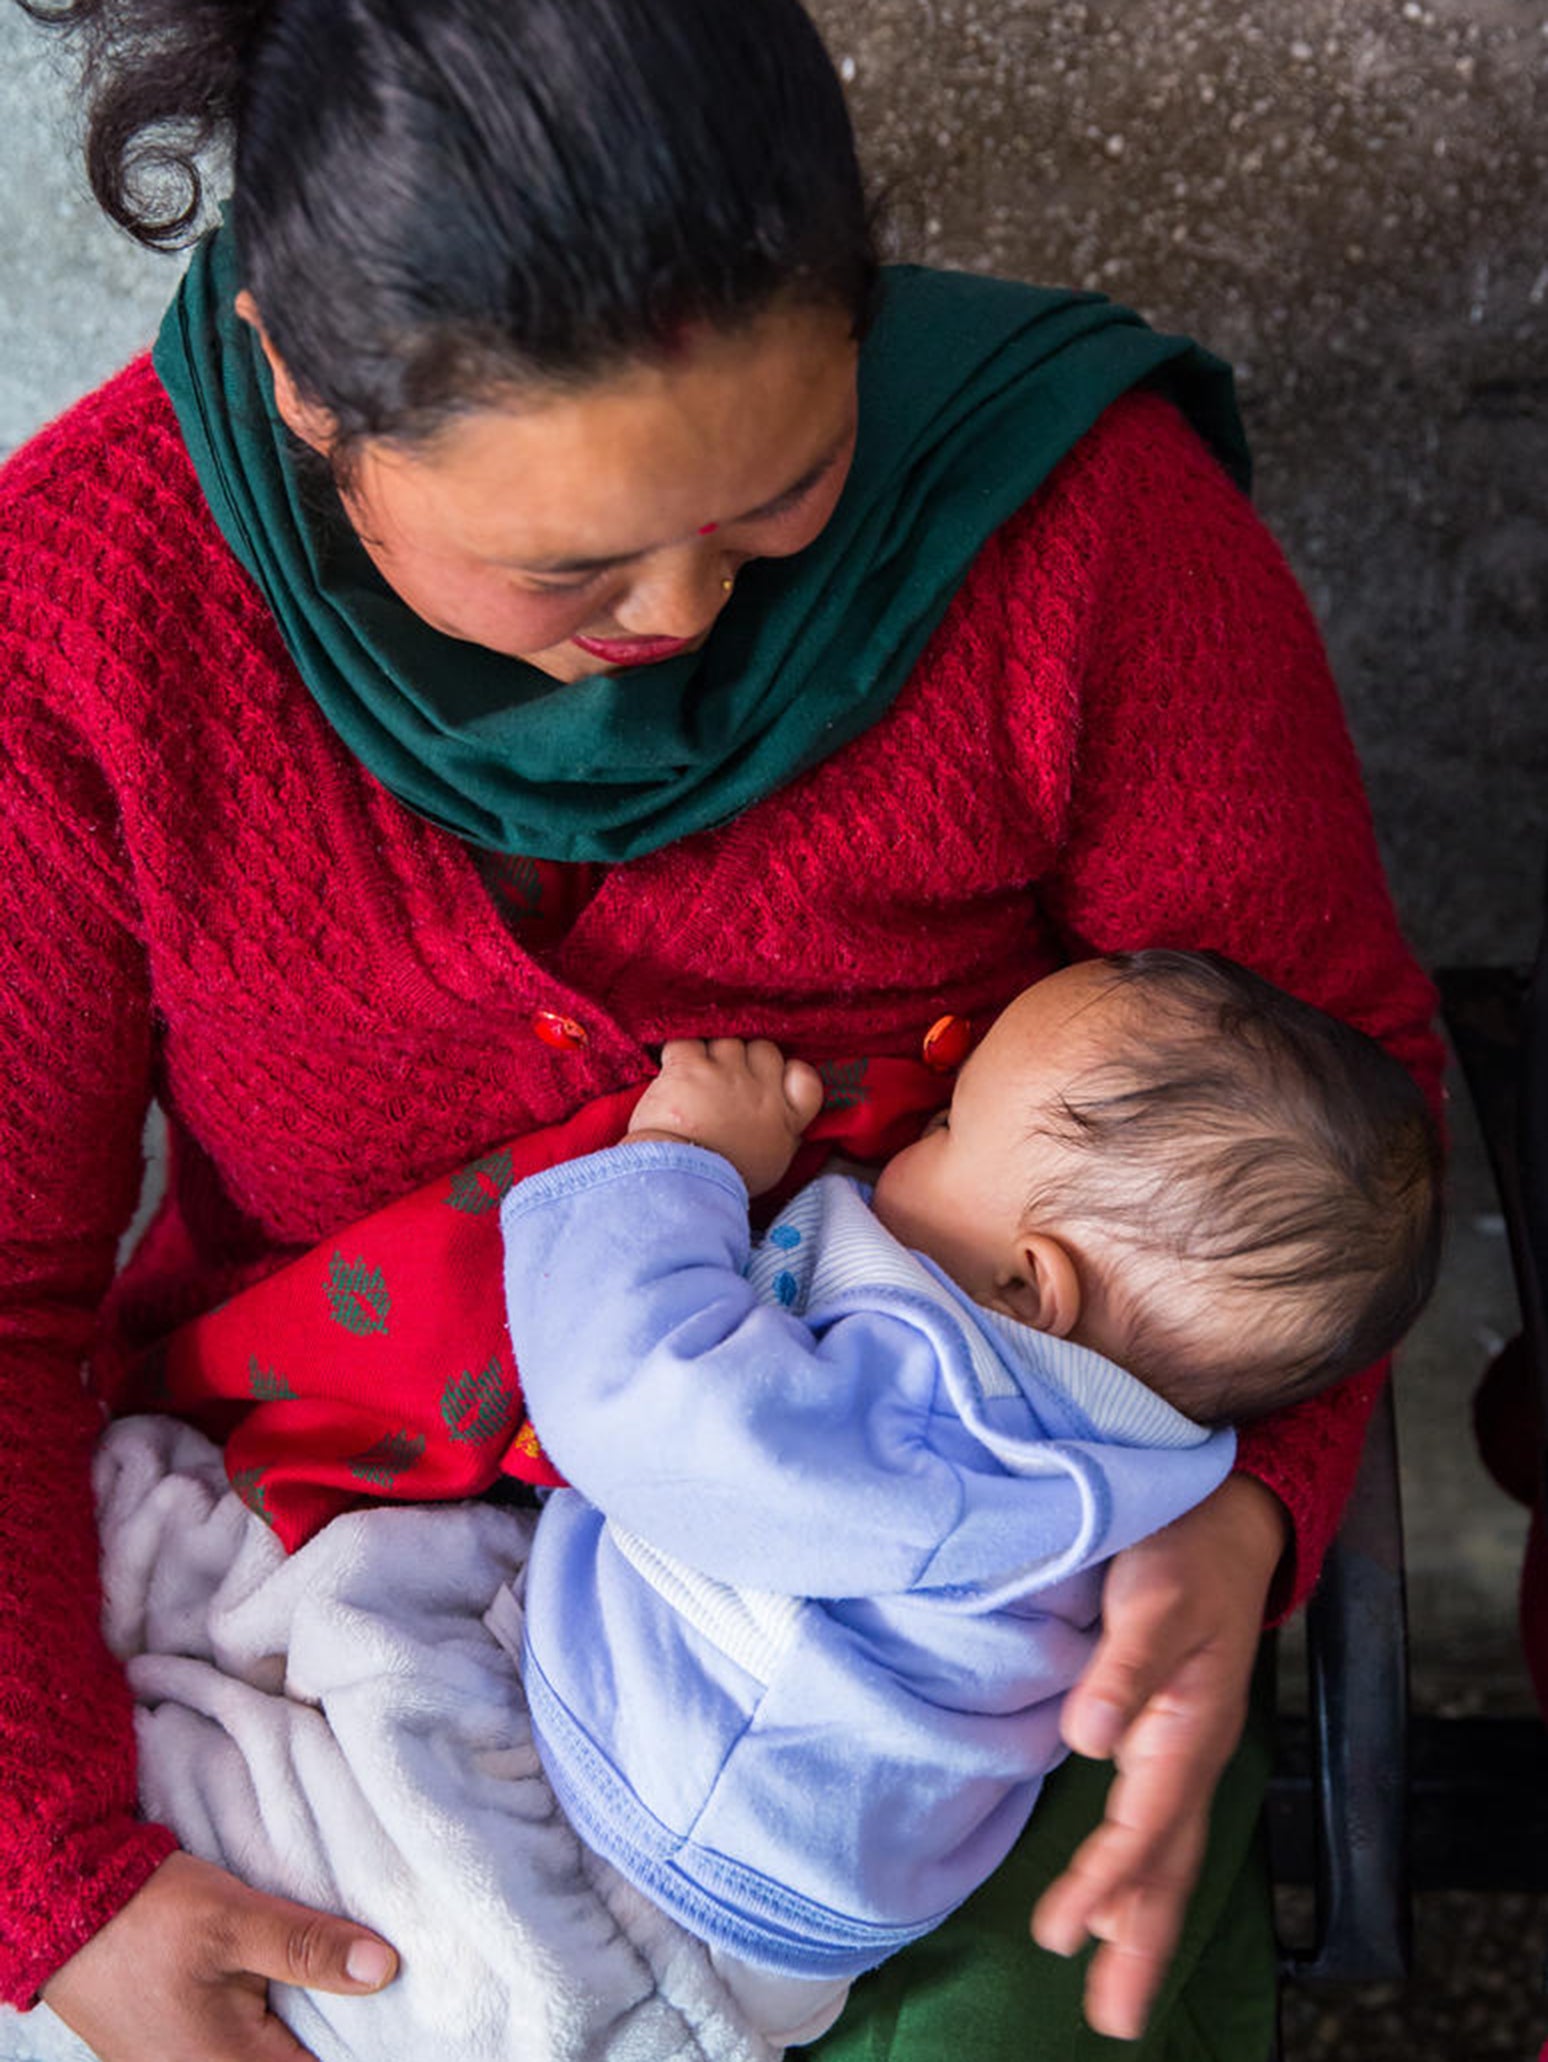
Over time, FCHVs offered more kinds of advice about maternal and child health care, such as optimal breastfeeding practices. Although exclusive breastfeeding and duration of breastfeeding has stayed basically flat, early initiation of breastfeeding (within the first hour) has increased dramatically, from 18 percent to 55 percent between 1996 and 2016. Similarly, prelacteal feeding decreased from 41 percent in 2001 to 29 percent in 2016. These trends are especially important because they signal a shift away from a cultural norm against feeding the baby colostrum, a vital source of infant nutrition.
In addition to providing information, FCHVs have been trained to deliver basic health products and services and refer patients to facilities for more advanced care. For instance, the FCHVs have been the linchpin on Nepal’s successful campaign to provide all children with high doses of Vitamin A semiannually. The campaign was relatively slow to get off the ground. Vitamin A’s effectiveness was researched locally, and then the program was piloted in 1993 in eight districts before being scaled up to all 75 by 2002. One study showed that this effort reduced the odds of death among 12 to 60-month-olds by slightly more than half. The FCHVs have also been instrumental in Nepal’s Community-Based Integrated Management of Childhood Illness (CB-IMCI) initiative (discussed below).
The FCHVs remain a pillar of the health system, providing both a source of local health knowledge and a critical link between far-flung communities and the public health system.
Basic Primary Health Services
National Health Policy
Framework for Nepali health system based on accessibility
TIMELINE: | 1991 to present |
In 1991, as the FCHV program was scaling up across the country, the government released a National Health Policy designed to “upgrade the health standards of the majority of the rural population by extending Basic Primary Health Services up to the village level.” The policy envisioned the creation of sub-health posts staffed by “one village health worker, one maternal and child health worker, and one auxiliary health worker” to reach all citizens. In conjunction with the growing cadre of frontline health workers, this policy promised to create a new health system based on the principle of access and equity. Up until the current day, the National Health Policy has been augmented by a series of detailed implementation plans and strategies, including the Second National Long-Term Health Plan (1997-2017) and successive sector strategies and implementation plans of varying lengths, all of which support the principles first laid out in 1991.
In 2006, Nepal issued its free health care policy, which provides essential health care services free of charge. Some services, including delivery services - normal, complicated, and caesarean sections - were free of charge to all women at government facilities nationwide. Other services were available free of charge to selected groups, including the poor, marginalized castes and ethnic groups, the disabled, the elderly, and FCHVs.
With support from a wide range of donors, the government spent the 1990s and 2000s investing in the growth in health facilities and human resources for health. Although data from the 1990s is sparse, we know that the number of doctors and nurses per 1,000 people increased from 0.7 in 2004 to 2.6 in 2014, bypassing the WHO’s guideline of 2.3 per 1,000 along the way. Only 19 percent of health training courses in Nepal are offered by the government. The remainder are offered by for-profit institutions that are clustered around Kathmandu and attract relatively well-off students who intend to stay in the city. As a result, there is still a serious shortage of staff in rural health facilities.
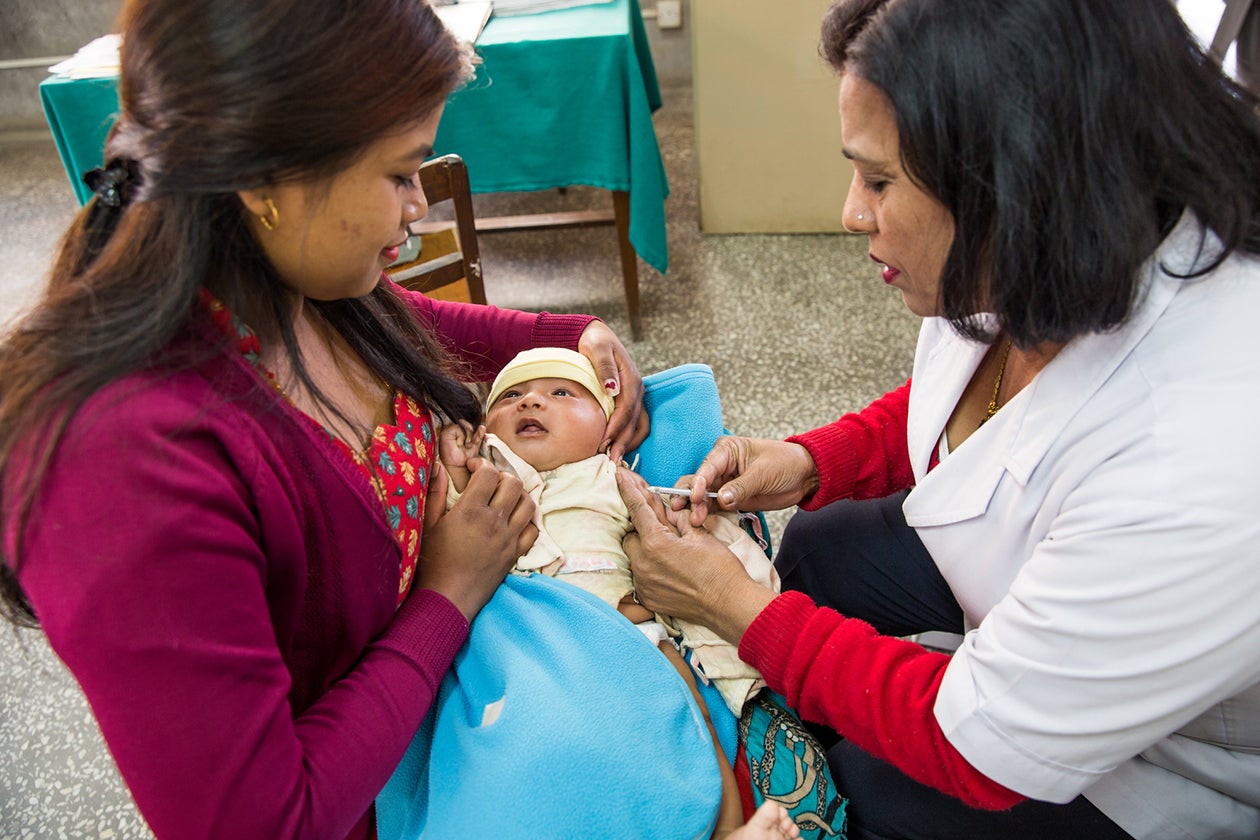
Still, investments in the health system, along with key policy changes, have led to a revolution in access. As one health worker in Dukuchhap put it, in comparison to the past 20 years, everything has improved and developed. There has been an immense improvement in health service delivery. The health facilities are built within 30 minutes walking distance. Road accessibility has also improved and made it easier to reach the health institutions of even urban places. One clear indication of the greater reach of the health system is the steadily increasing vaccination rates. Although the national immunization program was introduced in 1979, as late as 1996 only 65 percent of children received at least one dose of measles vaccine. By 2017, that number had improved to 90 percent.
Safe Motherhood Program
Safe Motherhood Program
Pilot program focused on prenatal care and skilled birth attendance
TIMELINE: | 1997 to 2002 |
COVERAGE: | nine poor districts in the western region of the country, though pieces were eventually scaled up nationally |
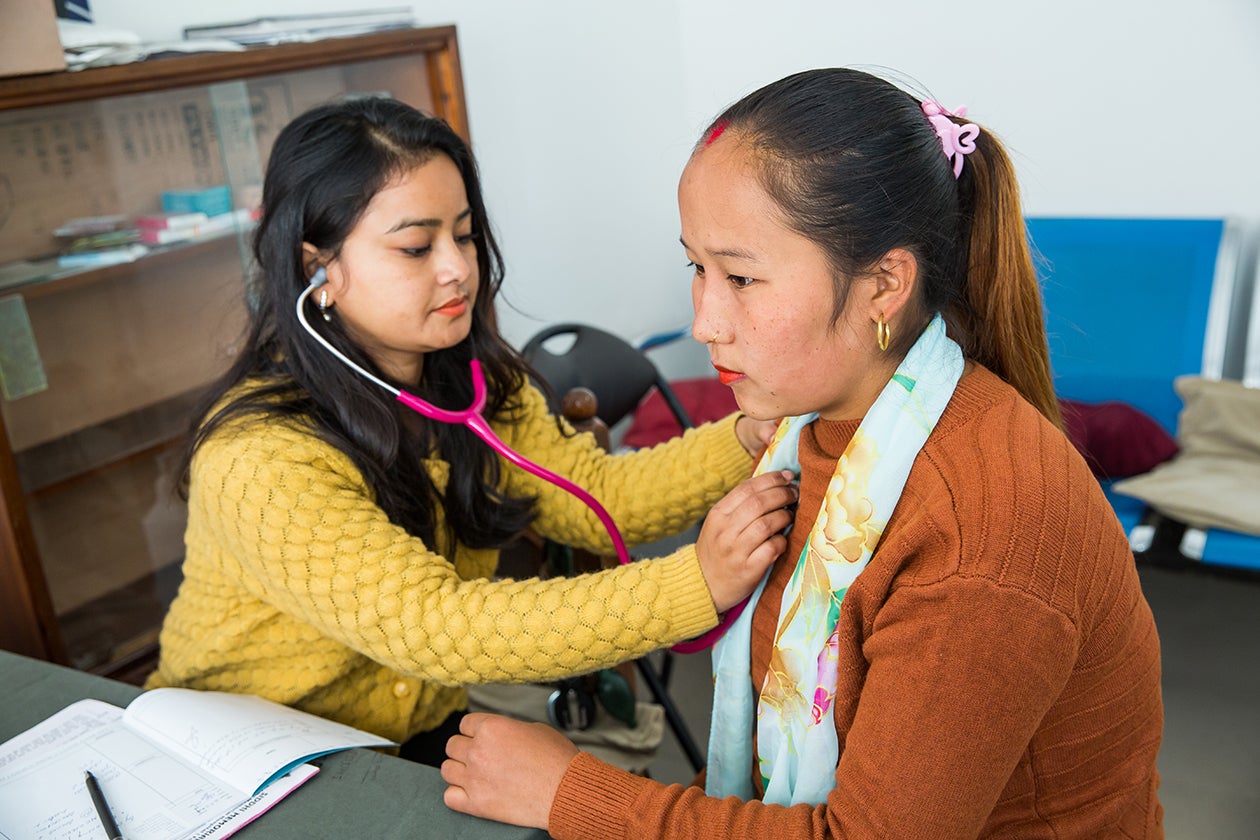
Spearheaded by the UK's Department for International Development, the Safe Motherhood Program focused on increasing access to high-quality obstetric care. Although coverage was limited to nine poor districts in the western part of the country (out of a total of 75 districts), or approximately 15 percent of the population, our informants suggest that the program led to a nationwide emphasis on safe motherhood.
In 2006, Nepal became one of the few countries in the region to have a specific skilled birth attendance policy. Between 2007 and 2011, the number of birthing centers in the country almost tripled.
Aama
In 2005, in response to research suggesting that women were not delivering in facilities because of the travel expense, Nepal launched the Maternity Incentive Scheme, later renamed the Safe Delivery Incentive Program. This initiative, which provided a cash incentive to mothers to deliver at a facility, went through some growing pains at first. Most mothers and many providers simply were not aware of it. Moreover, although the money was supposed to be provided at the time of delivery to defray transportation costs, there were long delays in disbursement.
Aama (“mother”)
Incentive scheme to promote prenatal care and skilled birth attendance
TIMELINE: | 2009 to present (originated in 2005 under a different name) |
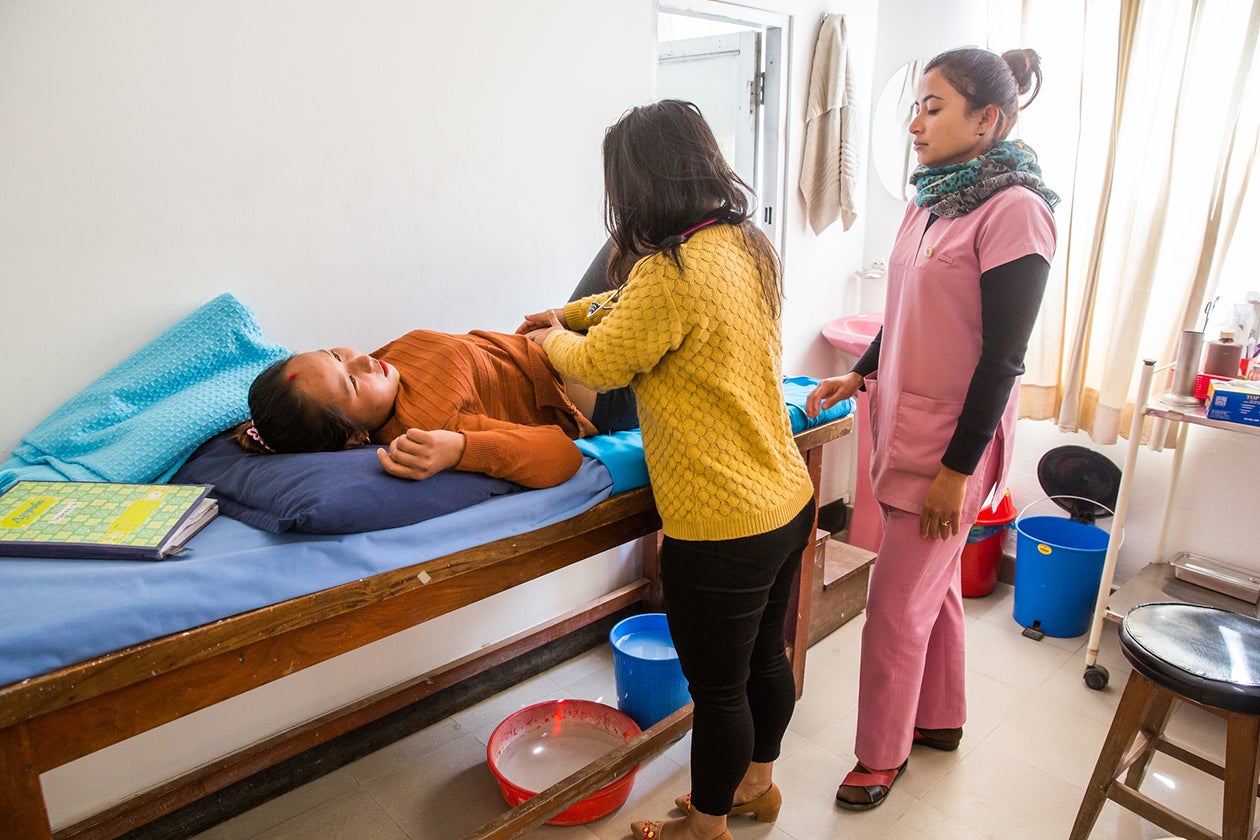
By the time the program was renamed again in 2009 - this time it was called Aama (which means “mother” in Nepali) - it was running more smoothly. Aama currently provides free delivery services at accredited facilities and a range of cash incentives to improve both the supply of and the demand for prenatal care and facility-based deliveries - specifically, it pays both pregnant women for seeking such services and caregivers for providing them. The facility delivery incentive varies according to the difficulty of reaching a health facility: it is $15 in the mountains, $10 in the hills, and $5 in the terai.
In 2001, just 28 percent of pregnant women received any prenatal care from a skilled provider. By 2016, that figure was 84 percent. Meanwhile, the percentage of women who made the recommended four visits quadrupled, from 14 percent to 69 percent. Progress in skilled birth attendance was just as impressive. In 2001, just 11 percent of pregnant women had a skilled attendant at birth, compared to 58 percent in 2016.
Community-Based Integrated Management of Childhood Illness
Community-Based Integrated Management of Childhood Illness (CB-IMCI)
Nepali adaptation of WHO/UNICEF protocol for diarrhea and pneumonia management
TIMELINE: | 1999 to present |
Community-Based Integrated Management of Childhood Illness (CB-IMCI) was designed to improve the detection and treatment of diarrhea, pneumonia, and other common child diseases. (It’s now called CB-IMNCI because community-based newborn care was folded into the protocol in 2014.) In 1995, the World Health Organization and UNICEF launched Integrated Management of Childhood Illness (IMCI) as a global initiative to bolster facility-based care. In Nepal, IMCI was implemented in a few facilities beginning in 1997, but in 1999 it was adapted so that FCHVs could also provide care in the village; hence the addition of “Community-Based” to the name. The program began in just three districts in 1999 but was gradually scaled up to all 75. FCHVs are now trained to diagnose and treat routine cases of diarrhea and pneumonia and refer more serious cases to the nearest health facility. Between 2001 and 2016, care-seeking for diarrhea and pneumonia in Nepal increased substantially. For example, the proportion of children with acute respiratory infections who were taken to a health facility increased from 26 percent to 85 percent.
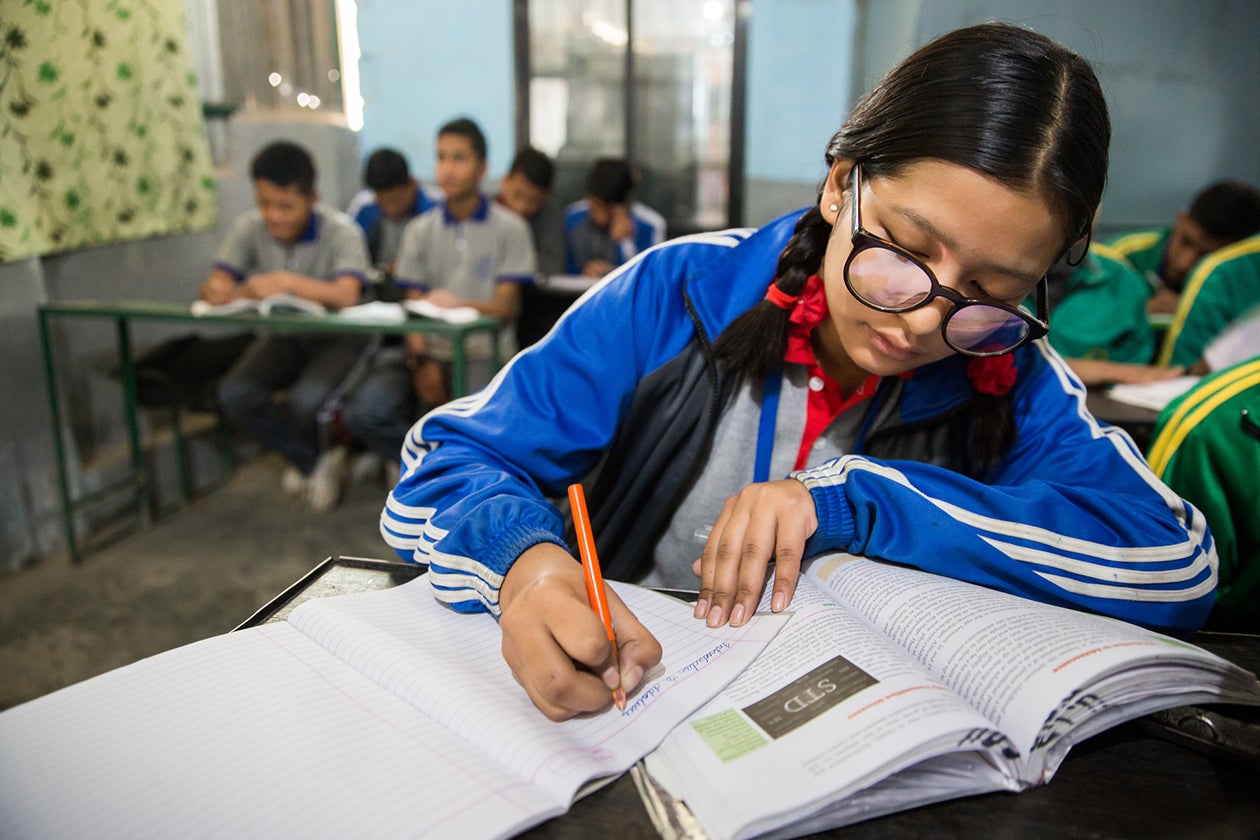
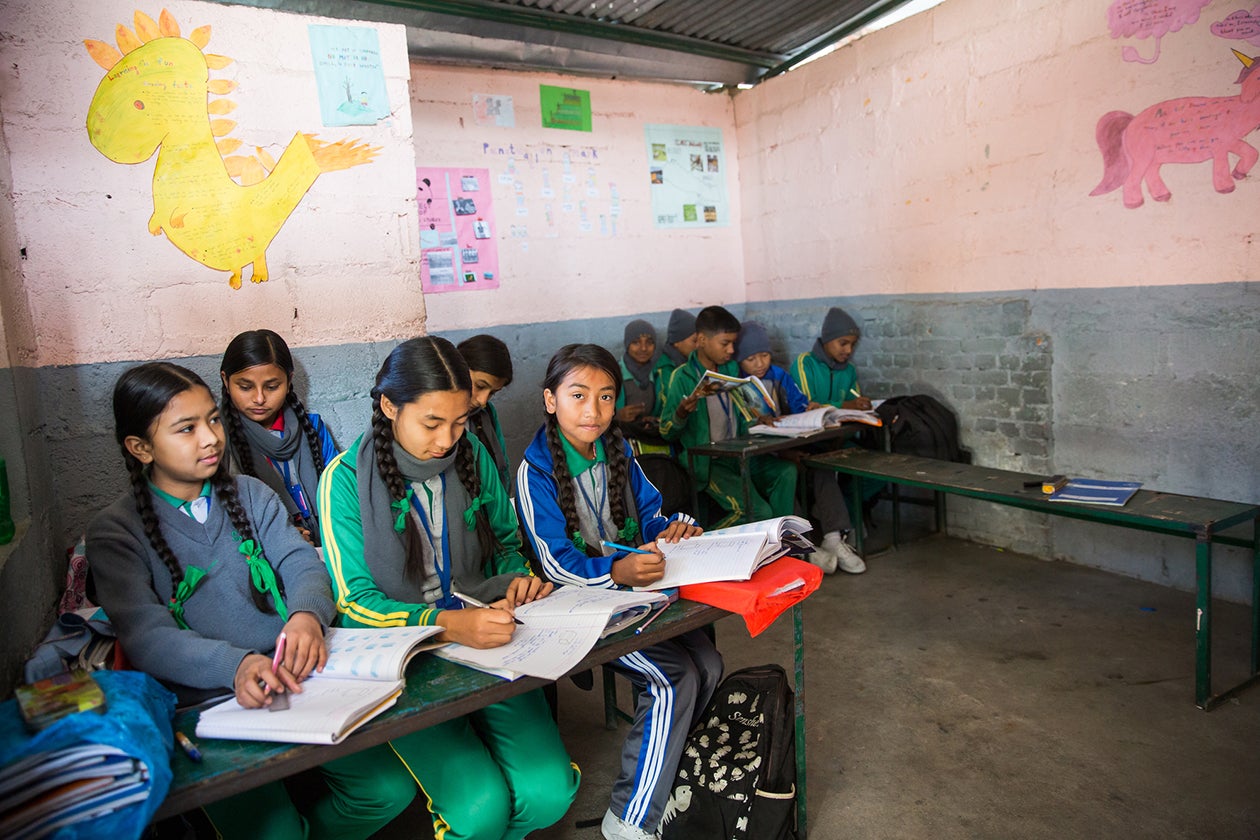
Education
Basic Primary Education Program
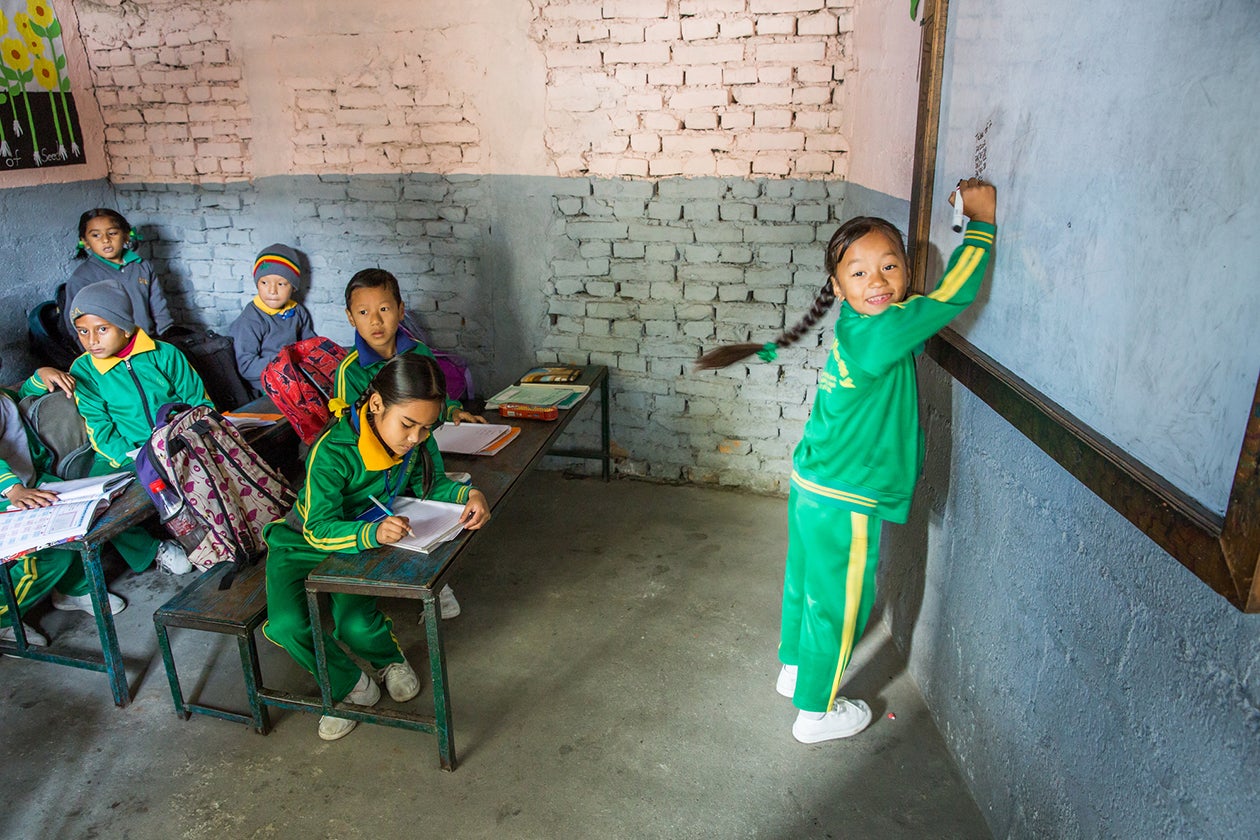
In 1990, primary school enrollment in Nepal was less than 70 percent, and the youth literacy rate was under 50 percent; for girls, it was just 33 percent. That year, the World Conference on Education for All, convened by UNESCO, UNICEF, the World Bank, the UN Development Program, and the UN Population Fund, met in Thailand. The conference moved education, especially basic and primary education, to the top of the development agenda, and donor funding increased considerably.
Basic Primary Education Program (BPEP)
Education program that began decentralization of Nepali schools
TIMELINE: | 1992 to 1999 (BPEP I); 1999 to 2004 (BPEP II) |
In the early 1990s, the government of Nepal responded to donor interest with a string of policies to decentralize and improve education. The first, the Basic Primary Education Program (BPEP), fundamentally reorganized the Nepali school system. Based on two successful donor-funded pilots from the early 1980s, BPEP created school resource centers that would offer support to clusters of ten to 15 nearby schools. This model allowed for meaningful decentralization and local engagement while addressing the lack of capacity at individual schools. Along with the structural reform, BPEP also focused on the basics of education: new and renovated facilities, teacher training, and classroom materials.
BPEP was succeeded by BPEP II in 1999, although the Maoist insurgency interfered with its implementation; during the war, 2,000 schools were closed and 150 teachers were killed. Nevertheless, by the time BPEP II concluded in 2004, the education landscape in Nepal looked considerably different than it had in 1990. The number of primary schools had increased by 39 percent, and the number of students enrolled had increased by 38 percent.
Education for All
In 2000, ten years after the original Education for All conference, the World Education Forum met again in Senegal. The participants adopted a list of six goals to be achieved by 2015, and UNESCO led the global movement and coordinated international efforts to achieve Education for All.
Education for All (EFA)
Education program that continued decentralization of Nepali Schools
TIMELINE: | 2004 to 2015 |
In 2004, Nepal launched its Education for All (EFA) program, designed to increase educational access, equity, and quality. EFA continued the trend of decentralization, transferring the management of more than 9,000 primary schools to local communities and making more resources available to schools through block grants. Education for All got close to its equity and access targets; in 2011, 98 percent of Nepali children, girls and boys, were enrolled in primary school. However, quality was tougher to achieve: attendance, promotion, completion, and learning outcomes were still low.
Goals of Education for All:
1. Expanding and improving comprehensive early childhood care and education, especially for the most vulnerable and disadvantaged children; |
2. Ensuring that by 2015 all children, particularly girls, children in difficult circumstances and those belonging to ethnic minorities, have access to a complete free and compulsory primary education of good quality; |
3. Ensuring that the learning needs of all young people and adults are met through equitable access to appropriate learning and life skills programmes; |
4. Achieving a 50 per cent improvement in levels of adult literacy by 2015, especially for women, and equitable access to basic and continuing education for all adults; |
5. Eliminating gender disparities in primary and secondary education by 2005, and achieving gender equality in education by 2015, with a focus on ensuring girls’ full and equal access to and achievement in basic education of good quality; |
6. Improving all aspects of the quality of education, and ensuring excellence of all so that recognized and measurable learning outcomes are achieved by all, especially in literacy, numeracy, and essential life skills. |
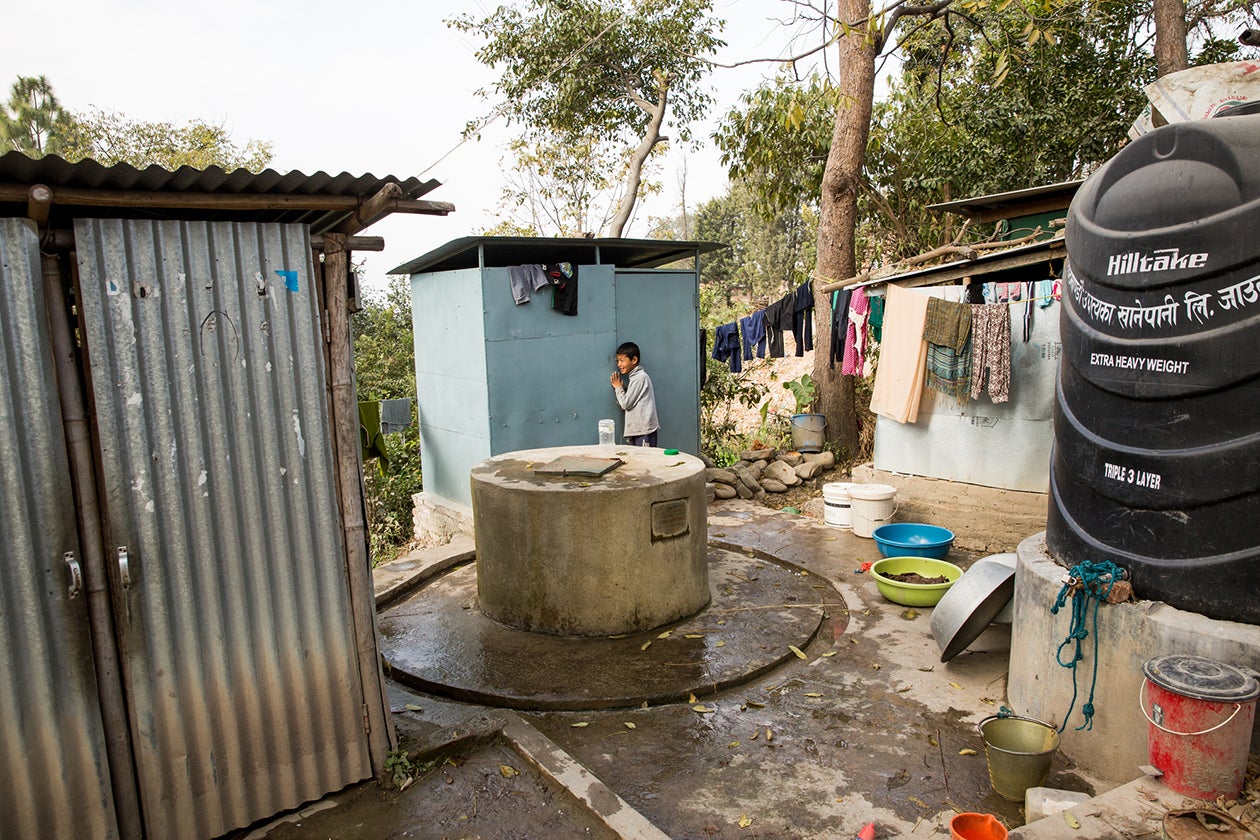
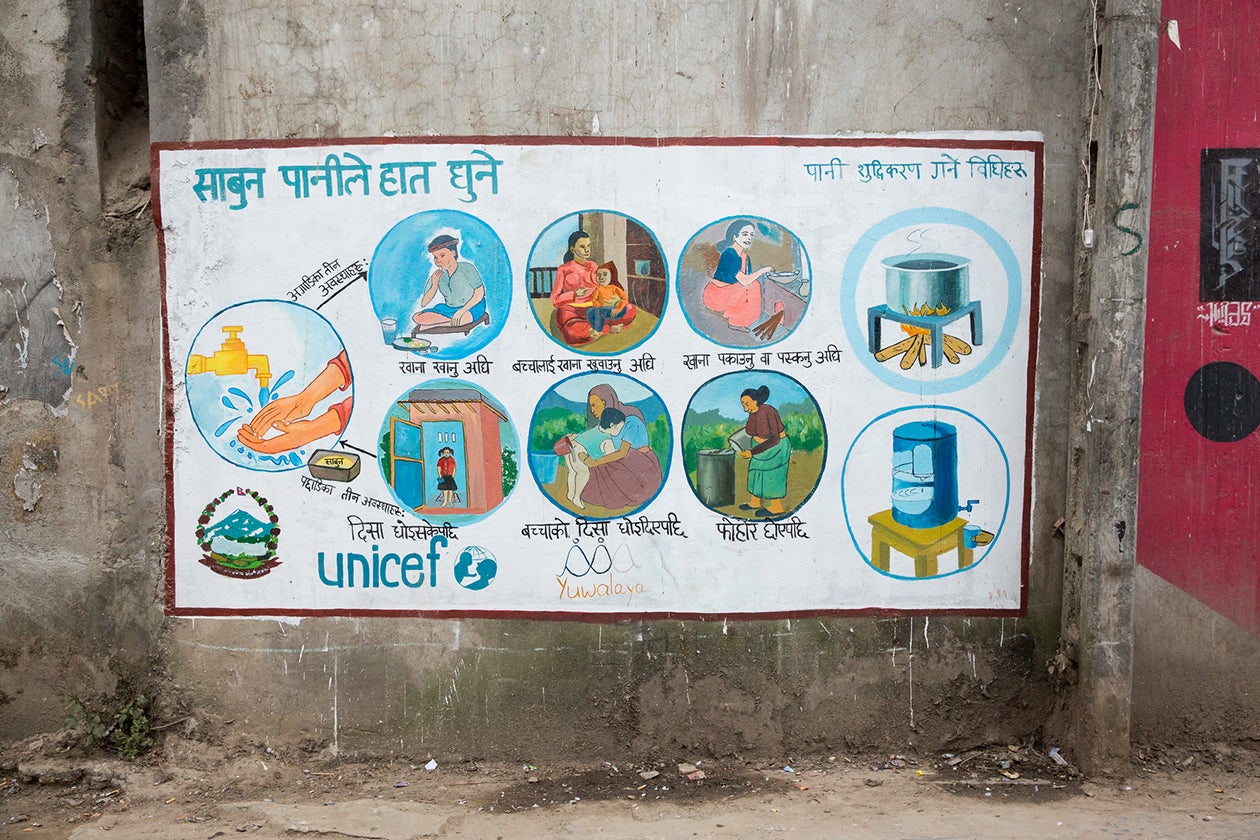
Sanitation
Community-Led Total Sanitation and Total Behavior Change
According to our decomposition analysis, reduced open defecation accounted for 13 percent of the increase in HAZ among Nepali children. Stunting is linked to the incidence of diarrhea and pneumonia, which is in turn linked to the prevalence of pathogens in the environment, which is in turn linked to the effectiveness of sanitation systems.
Like progress in health care and education, advances in sanitation were driven by external partners, although in this case NGOs led the way. Community-Led Total Sanitation (CLTS) was developed in 2000 in the Bangladeshi village of Mosmoil by Kamal Kar, an Indian development consultant, together with the Village Education Resource Center (VERC), a partner of WaterAid Bangladesh. Kar was working on traditional, subsidized programs, but he knew from experience that simply providing toilets was not going to solve any sanitation problems, because most of the villagers would end up using them as chicken coops, gardens, and the like. He persuaded VERC to adopt a more participatory approach that could generate demand instead of sinking more money into supply.
The process of CLTS is fairly straightforward; facilitators also have a lot of flexibility to adapt, especially depending on local context. They try to demonstrate the danger of open defecation, suggest that people build latrines, and “motivate early adopters” to persuade other villagers to use them.
Community Led Total Sanitation (CLTS)
Community-based, advocacy-led approach to ending open defecation
TIMELINE: | 2003 to present (adapted slightly and renamed Total Behavior Change in 2011) |
COVERAGE: | 47 of 77 districts have been declared open defecation free |
CLTS spread quickly through Bangladesh; the Water and Sanitation Program of the World Bank then helped it enter India, Indonesia, and parts of Africa. Over time, organizations like Plan International, UNICEF, WaterAid, SNV, Water Supply and Sanitation Collaborative Council (WSSCC), Tearfund, Care, World Vision, and others have endorsed CLTS, and governments are increasingly taking the lead. Today, CLTS has been adopted in 58 countries.
In 2003, representatives from WaterAid Nepal (WAN), Plan Nepal, Nepal Water for Health (NEWAH), and other government and civil society leaders visited Bangladesh to see CLTS in action; they liked what they saw and set up the first pilot in Nepal in October. Over the next two years, WAN and Plan supported a number of local NGOs, including NEWAH, in running CLTS pilots; meanwhile, a sector coordination committee was established to help spread the approach. In 2005, UNICEF piloted a modified approach, School-Led Total Sanitation (STLS), which used similar methods to CLTS but focused on children in schools instead of adults in communities and has continued to be part of the approach in Nepal.
CLTS INTERVENTIONS AND ACTIVITIES
| PROGRAMMATIC INTERVENTIONS | AGENT | SAMPLE ACTIVITIES | |
|---|---|---|---|
1 | Tools and Tactics | NGO staff | – Social mapping showing who defecates where – Calculation of quantity of feces (in kg) produced and eaten by one person in a year – Exposure visit to open defecation free communities – Feces mobility map/route to show the transfer and effects of feces, including fecal‐borne diseases |
2 | Action Committees | User Committees | User Committees formed in each cluster to implement, coordinate, monitor and evaluate program |
3 | Children’s Clubs and Activities | Children and youth | – Flagging areas of open defection – Conducting rallies and chanting against open defecation – Whistling at people found defecating in the opening – Making cartoons of people caught red‐handed and posting these and their names on public notice boards – Staging street dramas on sanitation and hygiene issues – Visiting homes to raise awareness – Helping community members who do not have time to build latrines |
4 | Facilitation | Community mobilizers/local facilitators, NGO and Plan Nepal staff | – Building rapport, inspire excitement among community – Orienting locals to different aspects of sanitation – Continuously following up on program progress |
5 | Monitoring | NGO and Plan Nepal staff | Conducting periodic monitoring visits |
6 | Rewards and Incentives | Community based revolving funds | Non-cash, direct or indirect (cash incentives provided in Sunsari and Morang) |
There were reports of coercion by communities (throwing stones, locking people out of their houses; one village official left a pile of feces on a woman's kitchen table) and facilitators (showing photos of babies with birth defects and explaining them as the result of poor sanitation), though it is not clear how widespread this coercion was.
In 2011, the government developed a National Sanitation and Hygiene Master Plan (2011-2017), which goes further than CLTS and adopts an approach known as Community‐Led Total Behavior Change in Hygiene and Sanitation or Total Behavior Change (TBC). TBC commits to the major tenets of CLTS but is different in some specifics, based on Nepal’s needs; it offers subsidies, for example, and operates on a much slower schedule more suited to a mountainous region with many remote villages where communication can happen only intermittently. As of 2018, just two decades after almost four in five Nepali households had no access to a toilet, 47 of Nepal's 75 districts have been declared open defecation free. Between 2001 and 2016, diarrhea incidence among children under five declined from 20 to 8 percent and pneumonia incidence from 23 to 2 percent. It remains to be seen if TBC will help the remaining 28 districts become open defecation free and drive diarrhea incidence closer to zero.
Poverty Reduction
Remittances
Although the government of Nepal created plans with poverty reduction as a goal and invested in some programs to alleviate poverty, the driving force behind the rapid decline in poverty in Nepal had less to do with the government than market forces.
In 1990, the issuance of passports was decentralized, making it much easier for Nepalis in rural areas to get them. Men started migrating, primarily to India, the Gulf states, and Malaysia. By 2010/2011, 53 percent of households had at least one member living outside the country for work. The total number of international labor migrants was almost 2 million. The remittances they sent home, worth $5.2 billion, amounted to one quarter of Nepal’s GDP.
Total number of absentees residing outside of Nepal from 1952 to 2011
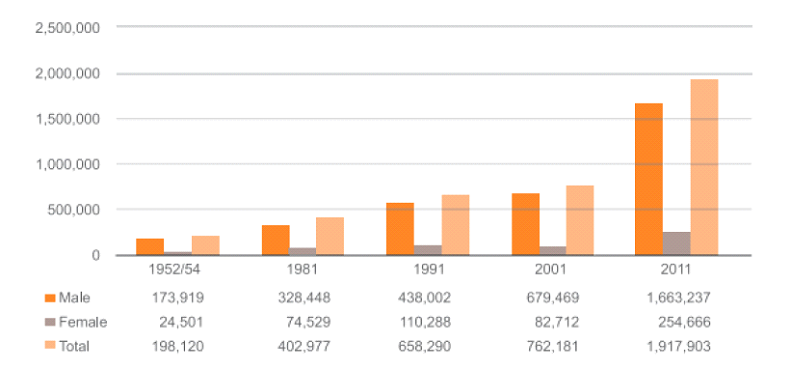
Deutsche Gesellschaft für Internationale Zusammenarbeit (GIZ) GmbH and International Labour Organization. Analysis of Labour Market and Migration Trends in Nepal. Kathmandu; 2015. Accessed 2020.
According to the World Bank, 40 percent of Nepali households rely on remittances to support their basic expenses, and 70 percent of households that receive remittances use them to pay for daily food and living expenses. Government surveys reveal that households with a member migrating for work were more likely to have enough food - and enough variety of food - to keep them healthy. According to a representative from UNICEF Nepal, remittances are “one of the major factor[s] to be considered for stunting reduction. When remittance comes to [a] family, they use it for consumption of varieties of food [and] health care.”
Use of Remittances by Wealth Quintile for the primary and secondary most important purposes

Data source: World Bank Staff Calculation based on Nepal Living Standard Surveys 1995/96 and 2010/11
One mother cited remittances as the main reason life in Nepal has improved. “Compared to early days,” she said, “it has improved a lot. We had nothing. We were very much poor. The major source of income was only agriculture. We struggled for minimal day-to-day survival. But now the times have changed. We are now economically strong. Our sons and daughters are abroad. They send us money.”
Ironically, although remittances helped drive the poverty rate down by three-quarters in just 15 years, they may have also contributed to inequality. It costs money to migrate. In fact, migrants sometimes have to borrow to pay for travel and employment agency fees. As a result, better-off people from the Central and Eastern provinces of the country receive the most remittance income. Meanwhile, those in the Western provinces, with the fewest migrants and therefore the least remittance income, have the highest rates of stunting.