
Key Points
During the 2000–2015 study period, Peru saw declines of more than 50 percent in both neonatal mortality and overall under-five mortality (U5M).
Peru established itself as a model among lower middle-income countries for reductions in U5M, and as its gross domestic product (GDP) increased, U5M outcomes were on par with more affluent countries.
Peru's extraordinary progress in reducing U5M is the result of its engagement of community-level care, focus on equity, clear national health priorities, and implementation of innovative approaches grounded in local research, all working to address the health needs of a highly diverse country.
Under-five mortality in Peru over time, death rates per 100,000 children under five

Institute for Health Metrics and Evaluation (IHME). Global Burden of Disease Study (GBD 2017). Seattle, WA: IHME; 2018.
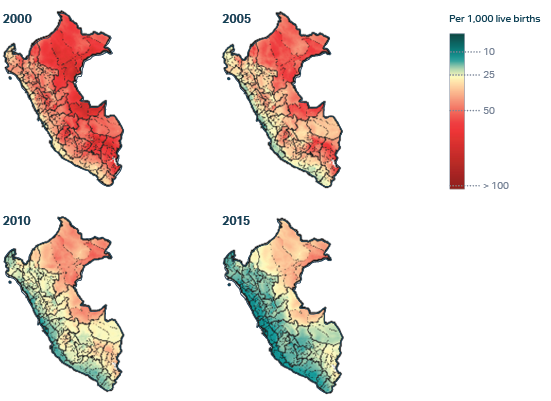
Peru experienced a 57 percent decline in mortality among children under the age of five (U5M) during the study period – from 38.6 deaths per 1,000 live births in 2000 to 16.6 per 1,000 live births in 2015.
Some equity gaps remain, however. The two poorest income quintiles experienced higher rates of U5M than the rest of the population. Geographic imbalances also persisted, with variances between regions and significant divergences in U5M rates between urban and rural areas.
The top three causes of death in 2000 among children under five were neonatal disorders, lower respiratory infections, and diarrheal diseases. By 2015, HIV/AIDS deaths had surpassed diarrheal diseases as the third largest contributor to under-five deaths in Peru.
Under-five causes of death in Peru over time, % of total U5M

Mortality rates among newborns under 28 days of age also declined in Peru. Neonatal mortality is an especially difficult and complex subcategory of child mortality, and improvements in the neonatal mortality rate (NMR) slightly lagged those for U5M as a whole – a typical phenomenon even among Exemplar countries. Peru’s neonatal mortality rate dropped from 15.5 deaths per 1,000 live births in 2000 to 7.6 per 1,000 live births in 2015, a decrease of 51 percent.
As with U5M overall, equity gaps were also evident in Peru’s progress to reduce NMR. However, the NMR disparities were less marked, and narrowed significantly by 2015 due to improvements across all wealth quintiles. A small NMR gap persisted between the top income quintile and all others, and some regional differences remained – including a persistent gap between urban and rural areas.
Compared with its five neighboring countries (Bolivia, Brazil, Chile, Colombia, and Ecuador), Peru recorded the largest percentage declines in both U5M overall and NMR during the 2000–2015 study period .
Peru’s standing in the world economy also shifted during the study period. In 2000, it stood among the lower-to-middle-income countries (LMICs), and in 2008 it shifted to upper-middle-income status. Among upper-middle-income countries, Peru has comparable U5M rates despite having a lower GDP than other upper-middle-income countries.
Change in under-5 mortality rate versus change in GDP per capita

Mortality rate, Peru
Peru’s efforts to reduce U5M benefited from contextual factors including strong and consistent leadership and prioritization of health and poverty-reduction initiatives and sustained economic growth that allowed for increasing investments in health. These investments included health systems strengthening efforts as well as expansions in health insurance and improvements in water, sanitation, hygiene and nutrition.,
Among the many factors that have made Peru an exemplar of how lower-income and middle-income countries can reduce U5M and NMR, four primary drivers stand out:
- Developing strong community-focused health systems and engaging at the community level, with a long-standing commitment to the training of community health agents and traditional healers.
- Consistently making equity a priority in implementation decisions.
- Establishing clear national health priorities to guide the actions of partners.
- Implementing innovative approaches based on research and integrating the findings into policymaking.