Selected Content
Annotations correspond to the block of highlighted content to the left.
Please log in to submit an annotation.
Please or .

EBI Coverage Data

Table V: Coverage of Selected U5M Interventions Based on Data Available from the DHS (Source: DHS 2000, 2005, 2010, and 2014

)

Selected Content
Annotations correspond to the block of highlighted content to the left.
Please log in to submit an annotation.
Please or .
 
U5 CAUSE OF DEATH INTERVENTION 2000 2005 2010 2014

Lower Respiratory Infections

Care-seeking for pneumonia  15.5% 27.9% 50.2% 53.9%
Vaccination: 3 doses of PCV        94.7%
Vaccination: Hib
    92.9% 98.2%

Diarrheal Diseases

Oral rehydration therapy
20.4%
23.7% 20.8% 19.5%
Vaccination: 3 doses of rotavirus vaccine
      94.7%
Care-seeking for diarrhea
13.8% 14.1% 37.2% 43.6%
Malaria
Insecticide-treated nets    12.6%
69.6% 67.7%
Care-seeking for fever  7.3%
28.5% 42.7% 49.2%
Treatment of children with fever by artemisinin-based combination therapy (ACT)      4.0%
11.2%
Prompt treatment of children with fever by ACT      2.6%
7.4% 
Measles Vaccination: Measles  86.9% 85.6% 95.0% 95.2%
HIV HIV counseling during antenatal care    55.8%
90.6% 93.0%
HIV testing during antenatal care    21.5%
88.3% 92.2%
Other vaccine preventable diseases  Full vaccination coverage with 3 doses DPT, 3 doses polio, measles and BCG  76.2%
75.5% 90.3% 92.7%
Neonatal Causes of Death Antenatal care: 1+ visits by a skilled provider  92.5% 94.4% 98.2% 99.1%
Antenatal care: 4+ visits by a skilled provider  10.0%
13.2% 36.2% 44.3%
Antenatal care: 1st antenatal visit in the 1st trimester  4.7%
8.5% 40.5% 56.4%
Vaccination: 1+ doses of tetanus toxoid vaccine during pregnancy  70.3%
63.0% 78.6% 82.4%
Delivery in a health facility  26.6%
28.2% 68.9% 90.7%
Delivery attended by skilled provider  31.3%
38.6% 69.0% 90.7%
Delivery by C-section  2.1%
2.9% 7.1% 13.0%
Postnatal care: Postnatal visit for baby within 2 days of birth  2.9%
3.7% 4.7% 19.3%
Postnatal care: Postnatal visit for mother within 2 days of birth      17.6%
43.0%
Selected Content
Annotations correspond to the block of highlighted content to the left.
Please log in to submit an annotation.
Please or .
DATA VISUALIZATIONS

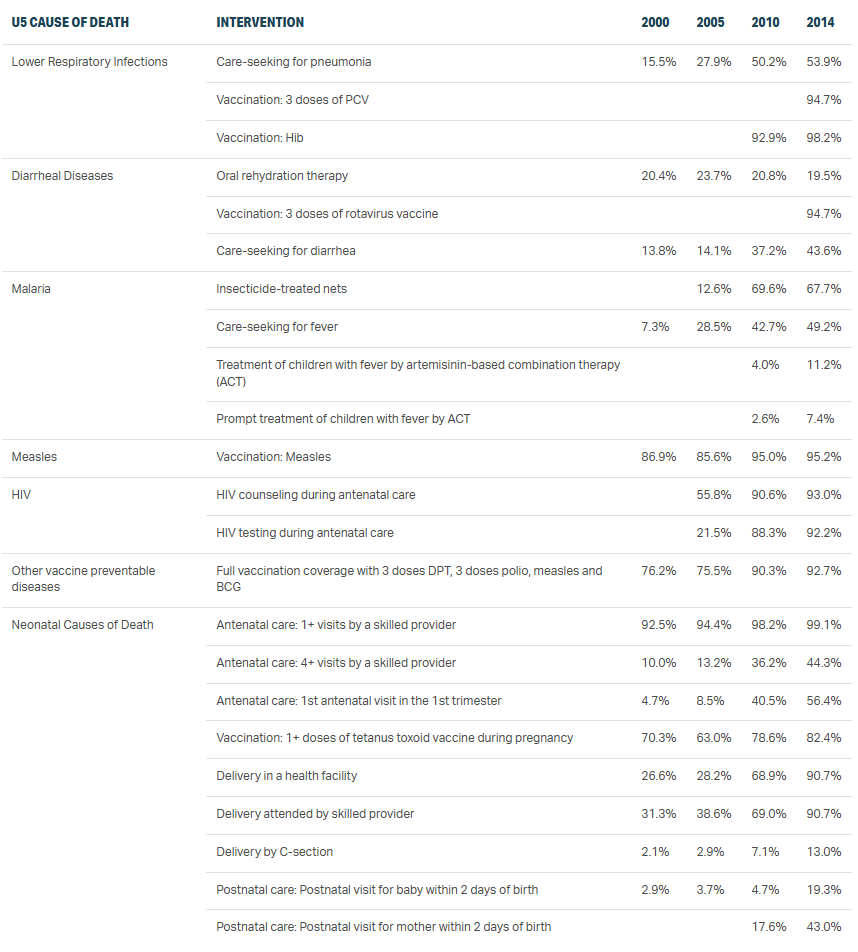
Explore data visualizations for under-five-mortality in Rwanda, or explore more Rwanda-specific data in the Data Explorer.

Selected Content
Annotations correspond to the block of highlighted content to the left.
Please log in to submit an annotation.
Please or .
Rwanda over time
Milestones graph
Under-Five Mortality, per 1,000 live births
Change in under-5 mortality rate versus change in GDP per capita
Countdown composite coverage index by wealth quintile
Diarrheal diseases mortality and intervention coverage in Rwanda
Health expenditure profile in Rwanda
HIV/AIDS mortality and intervention coverage in Rwanda
Location of bottom 10%
Lower respiratory infections mortality and intervention coverage in Rwanda
Malaria mortality and intervention coverage in Rwanda
Neonatal disorders mortality and intervention coverage in Rwanda
Nutritional deficiencies mortality and intervention coverage in Rwanda
Percent of women with facility-based delivery by wealth quintile
Percentage of women with facility-based delivery by geographic location
Rwanda decomposition of changes in all-cause mortality (2000-2016)
Rwanda has outperformed across other indicators relative to East African and Countdown to 2030 peers
Annualized % reduction, 2000 - 2015
Under-five mortality by wealth quintile
Under-five mortality rate per 1,000
Measles mortality and vaccine coverage in Rwanda
Under-five causes of death in Rwanda over time, % of total U5M
Under-five mortality in Rwanda over time, death rates per 100,000 children under five
Decomposition analysis
Lives Saved tool results for Rwanda
  1. 1
    Rwanda GDP Estimates, World Bank, http://databank.worldbank.org
  2. 2
    United Nations Development Programme, Human Development Reports, http://hdr.undp.org/en/data, Accessed Nov 1, 2018.
  3. 3
    Condo J, Mugeni C, Naughton B, et al. Rwanda’s evolving community health worker system: a qualitative assessment of client and provider perspectives. Hum Resour Health. 2014;12(1):71. doi:10.1186/1478-4491-12-71.; Chin-Quee D, Mugeni C, Nkunda D, Uwizeye MR, Stockton LL, Wesson J. Balancing workload, motivation and job satisfaction in Rwanda: assessing the effect of adding family planning service provision to community health worker duties. Reprod Health. 2016;13(1):2. doi:10.1186/s12978-015-0110-z.; External Evaluation of the Pilot Phase of the Home-Based Management of Malaria Program in Rwanda - Final Report.; 2007. https://pdf.usaid.gov/pdf_docs/Pdacj621.pdf. Accessed May 23, 2018.
  4. 4
    Institute for Health Metrics and Evaluation (IHME). Global Burden of Disease (GBD) 2016. Seattle, WA.

Resources