
Key Points
Ethiopia is a country of great diversity, both cultural and geographic, and this immense variety has created both opportunities and challenges.
The country has emerged from years of political repression and large-scale famine to achieve significant economic, political, and social gains.
Large-scale malnutrition still remains a threat, especially as climate change disrupts longstanding temperature and rainfall patterns.
Geography and Population
Ethiopia is a large, landlocked country located in the Horn of Africa. It shares borders with Eritrea to the north, Djibouti and Somalia to the east, Sudan and South Sudan to the west, and Kenya to the south. The country features great geographical diversity, with much of its landmass comprising mountain ranges and high plateaus divided by the Great Rift Valley. More than half of the country is 1,500 meters or more above sea level.
This topography has resulted in three primary climatic categories: Dega (cool) in the highlands over 2,500 meters above sea level; Woina Dega (warm to cool) in the intermediate zone between 1,500 and 2,500 meters above sea level; and Kolla (warm to hot) in the lowlands.
Overlapping these three temperature tiers are three seasons, defined by the presence or absence of monsoon rains. The season of spring rains (known as Belg), from February to May, features short periods of rainfall. Kiremt, which runs from June to September, is the season of long, monsoon-driven rains. The third season, Bega, brings dry and cool weather for most of the country from October to January.
ETHIOPIA'S THREE CLIMATIC REGIONS

Ethiopia’s unique topography and climates can affect child health, particularly due to the effect on malaria transmission.
Highland areas above 2,500 meters in altitude do not experience any malaria transmission; however, highland fringe areas between 1,500 and 2,500 meters experience frequent malaria epidemics. Lowland areas below 1,500 meters have seasonal patterns of transmission, while stable malaria areas of the country experience transmission throughout the year. Transmission often has an “unstable,” epidemic-prone pattern, with large variation in caseload from year to year as rainfall and temperature levels change.
Malnutrition is another major contributor to mortality among children under age five (under-five mortality or U5M), which is also influenced by geographic and climate factors. Ethiopia has experienced several severe droughts in recent history, which have contributed to significant food insecurity, migration, and political instability. A massive famine from 1983 to 1985 resulted in an estimated 1 million deaths. During the study period (2000–2015), significant droughts in 2002–2003 and 2011 led to food shortages and economic insecurity.,
Ethiopia is now the second most populous country in Africa, after Nigeria. Its population has expanded steadily over time, growing from 66.5 million in 2000 to 100.8 million in 2015. In 2015, 42 percent of the country’s population was under the age of 14.
Ethiopia's Population over time, from 1980 - 2018

World Bank. Population ages 0-14, total—Ethiopia [data set]. World Bank Data. Washington, DC: World Bank; 2019. https://data. worldbank.org/indicator/SP.POP.0014.TO?locations=ET. Accessed December 12, 2019
Ethiopia is also an extremely diverse country, consisting of more than 90 distinct ethnic groups who collectively speak more than 80 languages. According to the most recent national census (2007), the largest ethnic groups in Ethiopia are the Oromo and Amhara, who respectively make up 34 percent and 27 percent of the population. The most common religions are Ethiopian Orthodox Christianity (44 percent) and Islam (35 percent).
In 2015, a large majority of the country’s population (81 percent) resided in rural areas, which changed little from the start of the study period in 2000, when it was 85 percent.
Fully two-thirds of all land in Ethiopia is pastoral, used for the grazing and support of cattle, sheep, and other livestock. The herds and flocks – and the people who raise them – are highly mobile, shifting locations with the climate.
Ethiopia’s pastoralists (an estimated 10 to 12 million people) reside mainly in the country’s east, with the Somali and Afar regions respectively accounting for 53 percent and 29 percent of the total. Pastoralism also exists in Tigray, Benishangul-Gumuz, and Gambella regions.
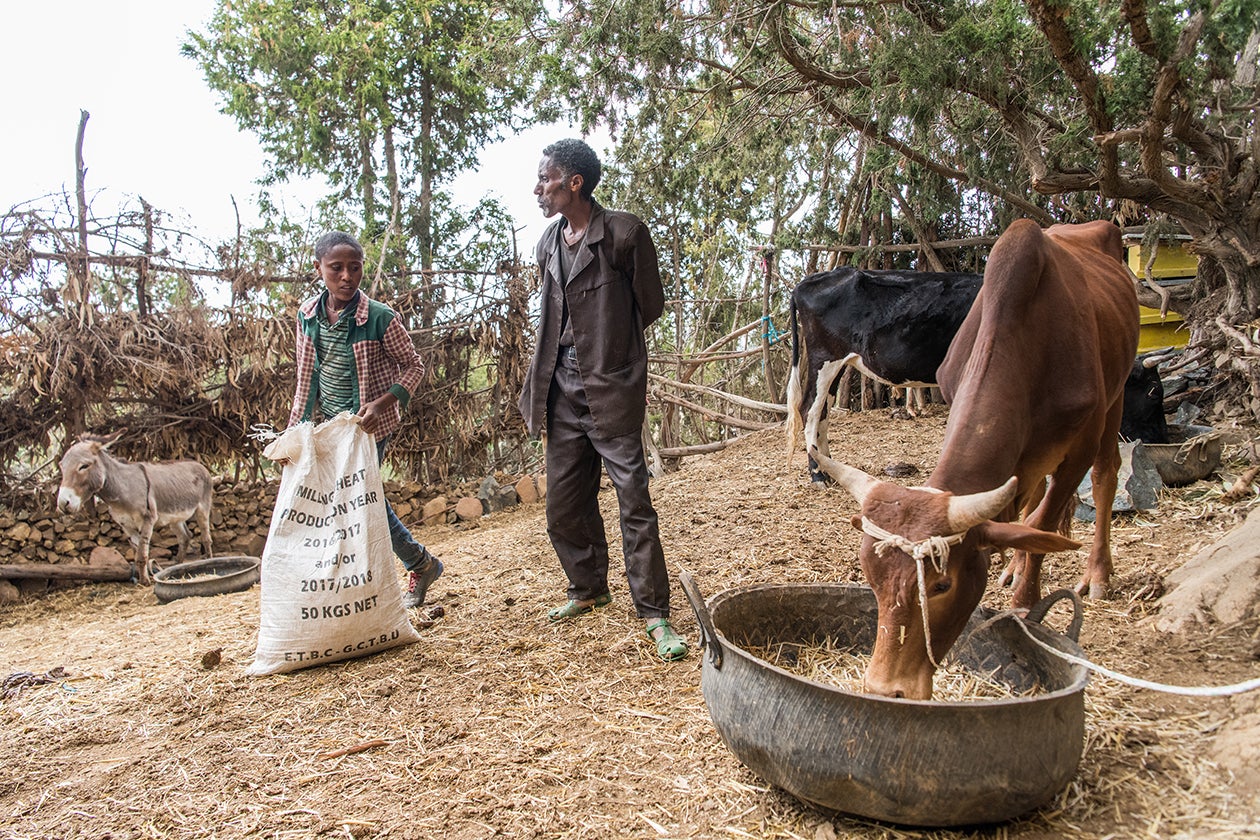
The relative lack of health infrastructure in pastoralist areas, and the highly mobile lifestyles of the pastoralists themselves, present significant challenges for Ethiopia’s Federal Ministry of Health (FMOH), and for partners seeking to deliver effective and acceptable health interventions.
The country’s population density rises substantially a bit further to the west. The center of Ethiopia – politically and economically as well as geographically – is Addis Ababa, the capital and largest city, with an estimated metropolitan-area population of 4.5 million.
The Oromia Region, an arc-shaped jurisdiction that surrounds (but does not include) Addis Ababa and spreads southward and westward, has 35 million people, almost equaling the entire population of Canada. Oromia and two other large regions – Amhara and the Southern Nations, Nationalities, and Peoples’ Region (SNNPR) – together accounted for an estimated 81 percent of Ethiopia’s total population as of 2012.
These and other regional states and city administrations are divided into 800 woredas (districts), which are further divided into over 30,000 kebeles (sub-districts).
The regional states were established with Ethiopia’s fourth and current constitution, adopted in 1994. That document, which formally created a Federal Democratic Republic of Ethiopia, marked the latest political incarnation of Africa’s oldest independent country.
History
The Ethiopian Empire was established in about 1270 and was overthrown by the Derg, a military junta, in a 1974 coup d’état that deposed Emperor Haile Selassie and led to a period of violent repression known as the Qey Shibir, or Red Terror, the death tolls for which have been estimated at anywhere between 30,000 and 750,000.
The Derg set up a Marxist-Leninist state under Mengistu Haile Mariam. Even after the 1978 conclusion of the Qey Shibir, the regime was marked by political repression until its fall in 1991. Soon afterward, the country became a federal parliamentary republic. Under Ethiopia’s new constitution, the country initiated a federalist system of ethnically based regions with notable cultural differences.
During the 2000–2015 study period, acute tensions among political factions challenged the country’s fledgling multiparty system, with elections marred by alleged fraud, intimidation, and post-electoral violence.
In addition to this internal strife, Ethiopia continued to experience varying levels of tension with neighboring Eritrea. In 1998, conflict over disputed land on the Ethiopian-Eritrean border of the Tigray and Afar regions led to war. Despite a 2000 peace treaty with Eritrea, tensions between the two countries persisted during the study period.
In addition to an estimated 70,000 total casualties, both countries experienced massive displacement of civilians and exacerbated economic problems, leading to food shortages.
During the study period, Ethiopia experienced frequent conflicts with Eritrea and Somalia, with significant conflict and displacement also occurring after the study period concluded, including in the Tigray, Afar, and Somali regions. In areas affected by the conflict, there was significant population displacement, with the potential to negatively impact height-for-age in children (although research conducted from 2000 to 2013 shows little correlation between wasting prevalence and presence of conflict in a region).
Research conducted from 2000 to 2013 found no increase in wasting in areas affected by conflict, compared with other regions. During the study period, two regions where fighting had occurred – Afar and Somali – experienced lower intervention coverage and higher mortality rates than other parts of the country.
A peace agreement was signed by both governments in December 2000, but tensions continued until a joint declaration that formally ended the war in July 2018. Ethiopia’s prime minister, Abiy Ahmed, subsequently received the Nobel Peace Prize in 2019 for his peacemaking efforts.
Contextual Factors
Economic Growth
Economically, Ethiopia is a combination of newfound dynamism and lingering poverty. It has the fastest-growing economy in all of Africa, with its gross domestic product (GDP) expanding by an average of 10.3 percent yearly from 2006–2007 to 2016–2017, compared with a regional average of 5.4 percent. In 2015 the GDP was US$64.5 billion, a nearly eightfold increase since 2000 when the GDP was US$8.2 billion.
Ethiopia’s economic growth is predominately attributable to agriculture, construction, and services. Its top exports in 2015 included coffee (US$900 million), refined petroleum (US$693 million), cut flowers (US$606 million), and gold (US$577 million).
The Ethiopian government is heavily engaged in the economy, owning key sectors such as telecommunications, electric power, banking, and insurance. It has also retained ownership of all land since 1991, a policy confirmed by the country’s new constitution of 1995.
The sustained economic boom has led to a reduction in poverty. In 2004, 38.7 percent of Ethiopians lived below US$1.90 a day (the World Bank’s threshold for extreme poverty); by 2015, it was down to 23.5 percent. Reductions in poverty occurred across all regions of the country, though regional disparities remained – in 2011, the proportion of people living below the national poverty line ranged from 11 percent in Harari Region to 36 percent in Afar Region. Ethiopia’s human development index also improved during the study period, increasing from 0.283 in 2000 to 0.451 in 2015.
Percentage of Ethiopians living below poverty line

World Bank. Poverty headcount ratio at USrich-text__embed l-rte-full.90 a day (2011 PPP) (% of population) – Ethiopia [data set]. World Bank Data. Washington, DC: World Bank; 2019. Accessed Dec 2019.
This economic vitality played a part in facilitating many evidence-based interventions and reducing U5M. Robust and rapid improvements in infrastructure were relevant to public health – including a range of policies addressing water, sanitation, and hygiene (WASH), such as improved access to clean water sources and campaigns to end the formerly widespread practice of open defecation. Economic growth also fueled increased investment in health education programs and facilities, in turn boosting the supply of skilled, trained practitioners.
Ethiopia also undertook a series of initiatives aimed at both the causes and effects of extreme poverty, including measures to reduce the economic vulnerability of subsistence farmers and pastoralist communities.
Even with all of this progress, Ethiopia remains one of the poorest countries in the world, with a 2015 GDP per capita of only $1,518 (PPP constant 2011 international $), though it should also be pointed out that the country has one of the lowest levels of income inequality in Africa, with a Gini index of 39.1 in 2015 (improved from 30 in 1999).,
Effective Coordination of Resources to Strengthen the Health System
In addition to the impressive growth of its economy, Ethiopia has skillfully drawn upon – and coordinated – financial support and other resources from donors and implementing partners. Multilateral organizations such as Gavi and the Global Fund to Fight AIDS, Tuberculosis and Malaria invested heavily in Ethiopia’s initiatives to reduce U5M between 2000 and 2015, and several domestic and international partners worked on interventions to reduce child mortality, especially in the preparation and implementation phases.
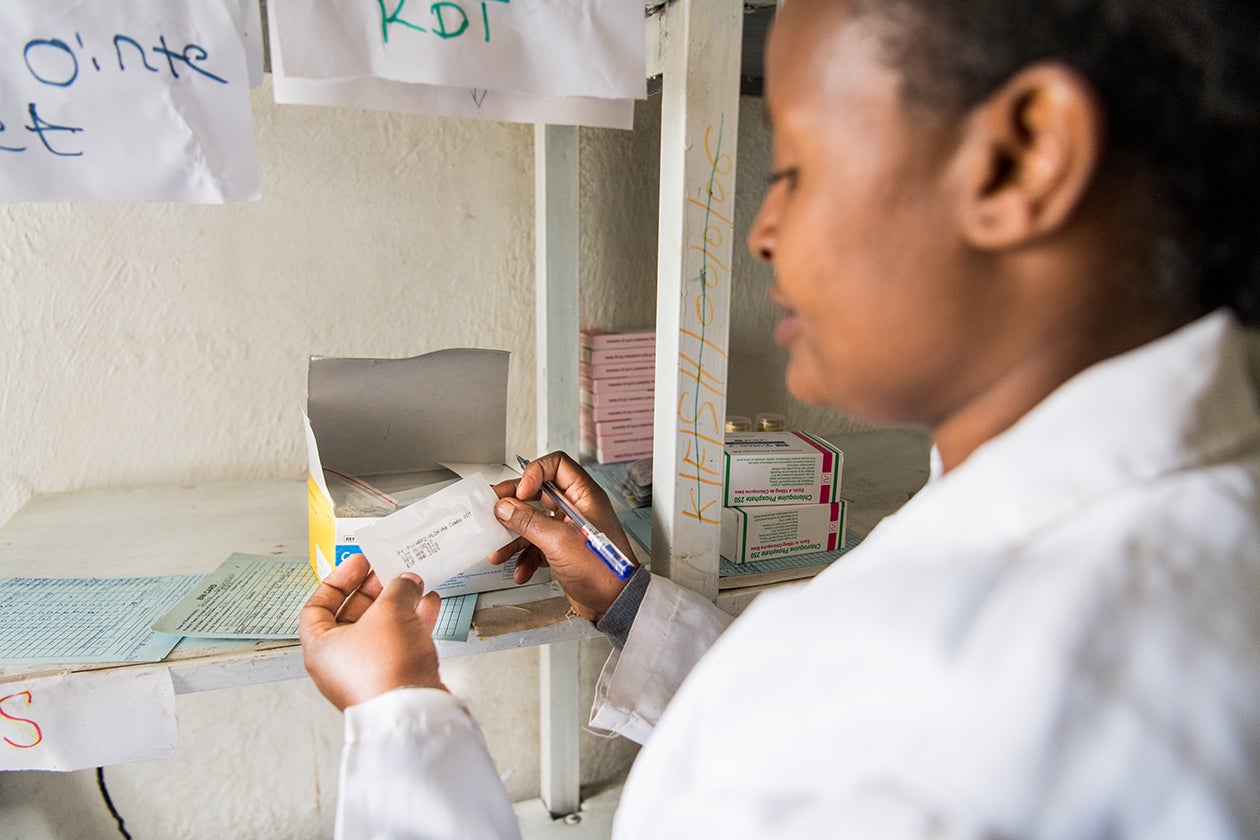
The government invested significantly in establishing and improving public health facilities throughout the study period, and the introduction of the Health Extension Program strengthened Ethiopia’s approaches to community-based care. This emphasis on strengthening the capacity of the health sector resulted in an increase in the number of graduates entering the field, though personnel turnover is high, and many communities still suffer from a lack of doctors, nurses, and midwives – particularly in rural areas. Regional disparities in health personnel coverage contributes to persistent geographic inequalities in health incomes across Ethiopia.
The private health sector in Ethiopia has experienced substantial growth, particularly in Addis Ababa. By 2007–2008, that city alone had 25 private hospitals. The 2016 Demographic and Health Survey (DHS) reported that only 1.1 percent of women nationally had delivered at a private facility – but 22.2 percent of women in Addis Ababa had done so. Both figures, however, had doubled since 2005, with 0.5 percent of all Ethiopian women and 11 percent of women in Addis Ababa reporting private-facility births at that time.
Private facilities also play a significant role in treating childhood illness. Among all children receiving treatment for acute respiratory infection in 2016, 16 percent received care at a private-sector facility. For diarrhea, it was 20 percent.
Another example of the government’s engagement in strengthening health care capacity is its data systems. Ethiopia has invested in national surveys, Health Management Information Systems, domestic institutes and local studies. With a well-established history of valuing data and using it for planning, prioritization, and implementation of new initiatives, the government was effective in using data to inform many of its policies.
Education
Whether Ethiopia can sustain its progress in the long term will depend on many factors, including the educational attainment of its people. Overall, the educational status of Ethiopia’s population has improved in recent years, though important gaps remain. The overall adult literacy rate was only 52 percent in 2017, but it represented a significant improvement from 27 percent in 1994.
There are signs of further improvement in the years ahead. In 2015, 85 percent of Ethiopian children entered primary school, a remarkable increase from 40 percent at the beginning of the study period in 2000. During the same period, the completion rate for primary school increased from 22 percent to 54 percent.,
Improvements in Gender Equity
In addition to continued economic and geographic imbalances, gender equity remains a challenge in Ethiopia – in educational outcomes and elsewhere. The female primary-school entrance rate increased to 81 percent in 2015, but it remains below the male primary-school entrance rate of 88 percent. Furthermore, the literacy rate for adult women was only 44 percent in 2017, compared with 59 percent for adult men.
Yet there has also been progress. Among women who were able to enter secondary education, 91 percent went on to graduate as of 2014, just one percentage point below the figure for males. In addition, the proportion of married women currently employed increased from 32 percent in 2005 to 48 percent in 2016 (still less than half of the 88 percent employment rate for men).
The vast majority of women had either primary or joint control over their earnings in 2016, with only 8 percent saying their earnings were mainly controlled by their husband. The rate of home ownership was similar among men and women.
Overall, the World Economic Forum’s Global Gender Gap Report 2018 ranked Ethiopia 117th in gender equity of the 149 countries surveyed. In 2006, Ethiopia ranked 100th out of 115 countries.